Key Highlights
- The Bitcoin price after trading as high as ¥3340 against the Chinese Yuan found resistance and started correcting lower.
- BTCCNY has cleared a major support area and looks set for more declines if sellers remain in control.
- A test of a major support area at ¥2200 is possible where there is a chance of buyers taking a stand.
Bitcoin price enjoyed a solid bullish ride recently, but it looks like it has started a corrective phase that might continue moving ahead.
Sell Rallies?
The Bitcoin price after struggling to clear the ¥3400 level started to correct lower. However, it looks like the corrective rally has gone too far, as the price broke an important support area of ¥2500. The stated break might come as an encouragement for sellers to take the price further down. There was a flag pattern formed recently on the hourly chart, which was breached to clear the way for more losses.

The price is currently finding bids around ¥2340, which might ignite a small pullback in two waves. An initial resistance in this case may be around the 23.6% Fib retracement level of the last DROP from the ¥3340 high to ¥2336 low. The mentioned Fib level is also positioned around the broken flag support, suggesting ¥2570 may act as a hurdle for buyers.
Looking at the indicators:
MA – The 100 hourly simple moving average (SMA) is perfectly aligned with the highlighted resistance area of ¥2570, pointing it as a sell zone.
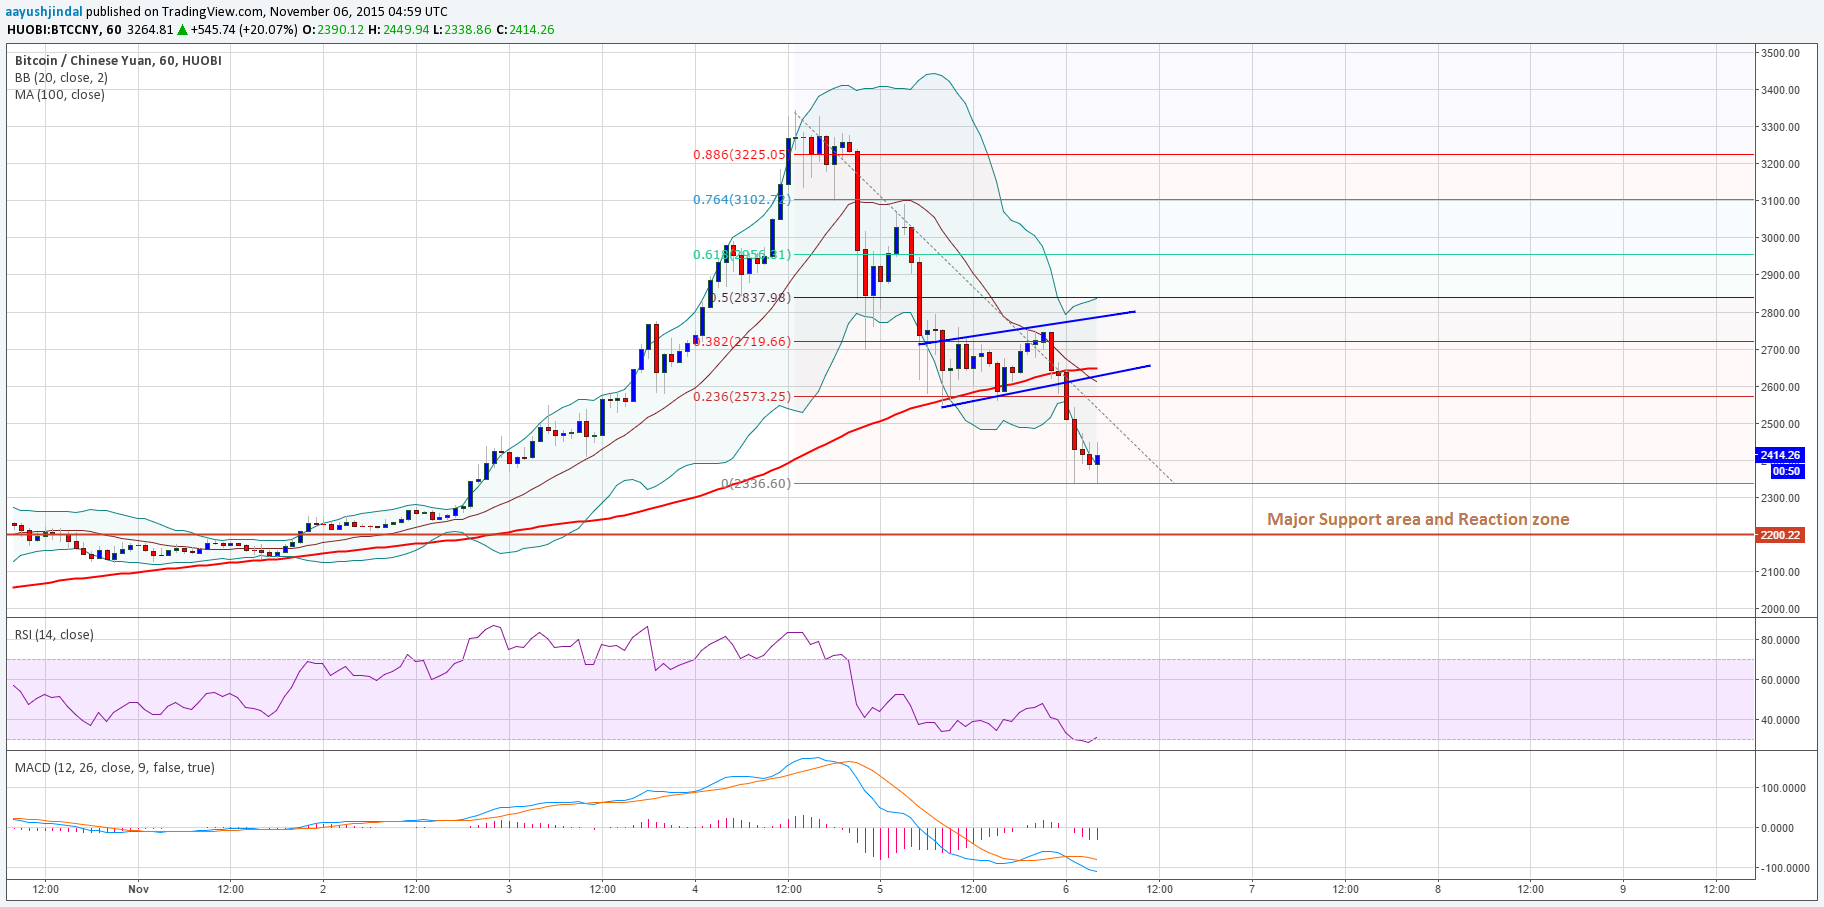
RSI (Relative Strength Index) – The hourly RSI is around the oversold readings, suggesting a minor pullback is possible moving ahead.
On the downside, a break below the recent low of ¥2336 may open the doors for a test of ¥2200.
Intraday Support Level – ¥2336
Intraday Resistance Level – ¥2570
Traders may keep an eye on the ¥2570 resistance area for a possible sell opportunity.
Charts from BTCCHINA and HUOBI; hosted by Trading View