

Key Highlights
- In one of the previous week’s analysis, I suggested that buying favored in Bitcoin price near ¥2600. The idea played well, as the price bounced and traded higher.
- However, as stated earlier, the ¥3100 resistance area holds the key, and is currently stalling more gains.
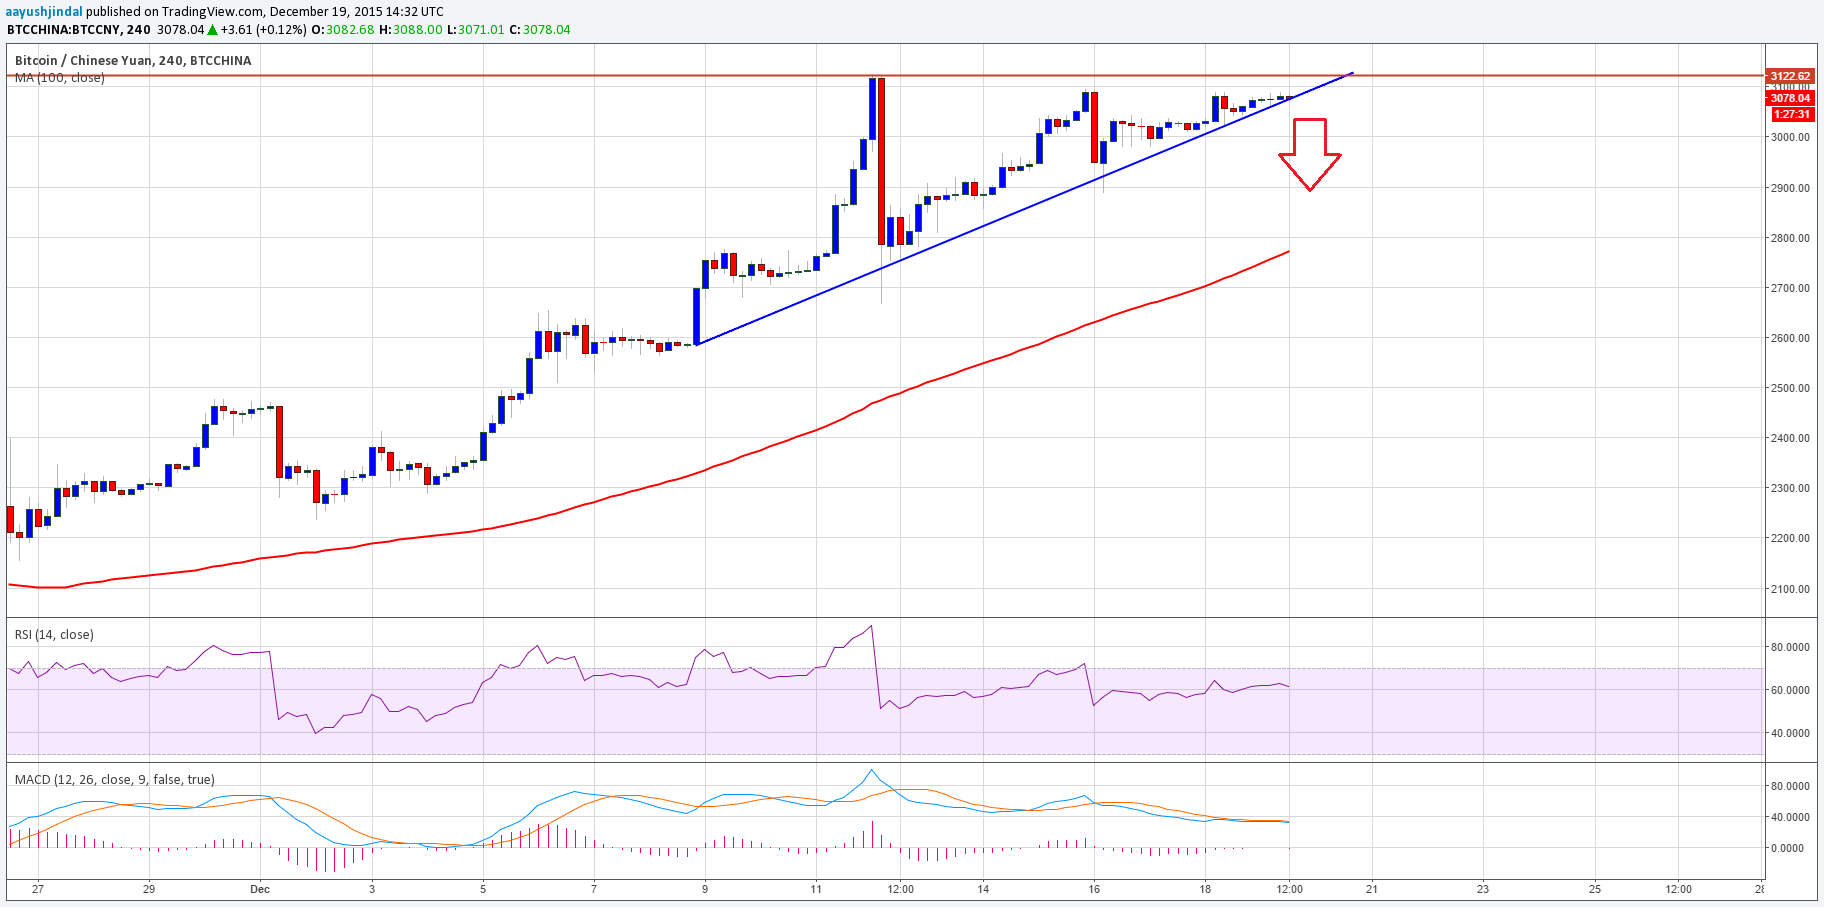
- Buyers need to be very careful moving ahead, as a break below a major support trend line on the 4-hour chart (data feed from BTCChina) may call for a correction.
Bitcoin’s price gained heavily this past week, but it looks like a short-term top is created near ¥3100, and there is a chance of a down move during the upcoming week.
Sell with a Break?
Bitcoin’s price continued to trade higher this past week against the Chinese yuan, but it looks like there is a major resistance forming near ¥3100. So, buyers should not rush chasing the price higher, as there is a chance of a break lower. There is a major bullish trend line formed on the 4-hour chart (data feed from BTCChina), which is currently acting as a hurdle for sellers. However, the price is losing momentum, which is an early indicator that it may break down.
A break below the trend line and support area may start a bearish move and take the price lower. In this situation, the price could head towards the 100-hour simple moving average on the 4-hour chart.
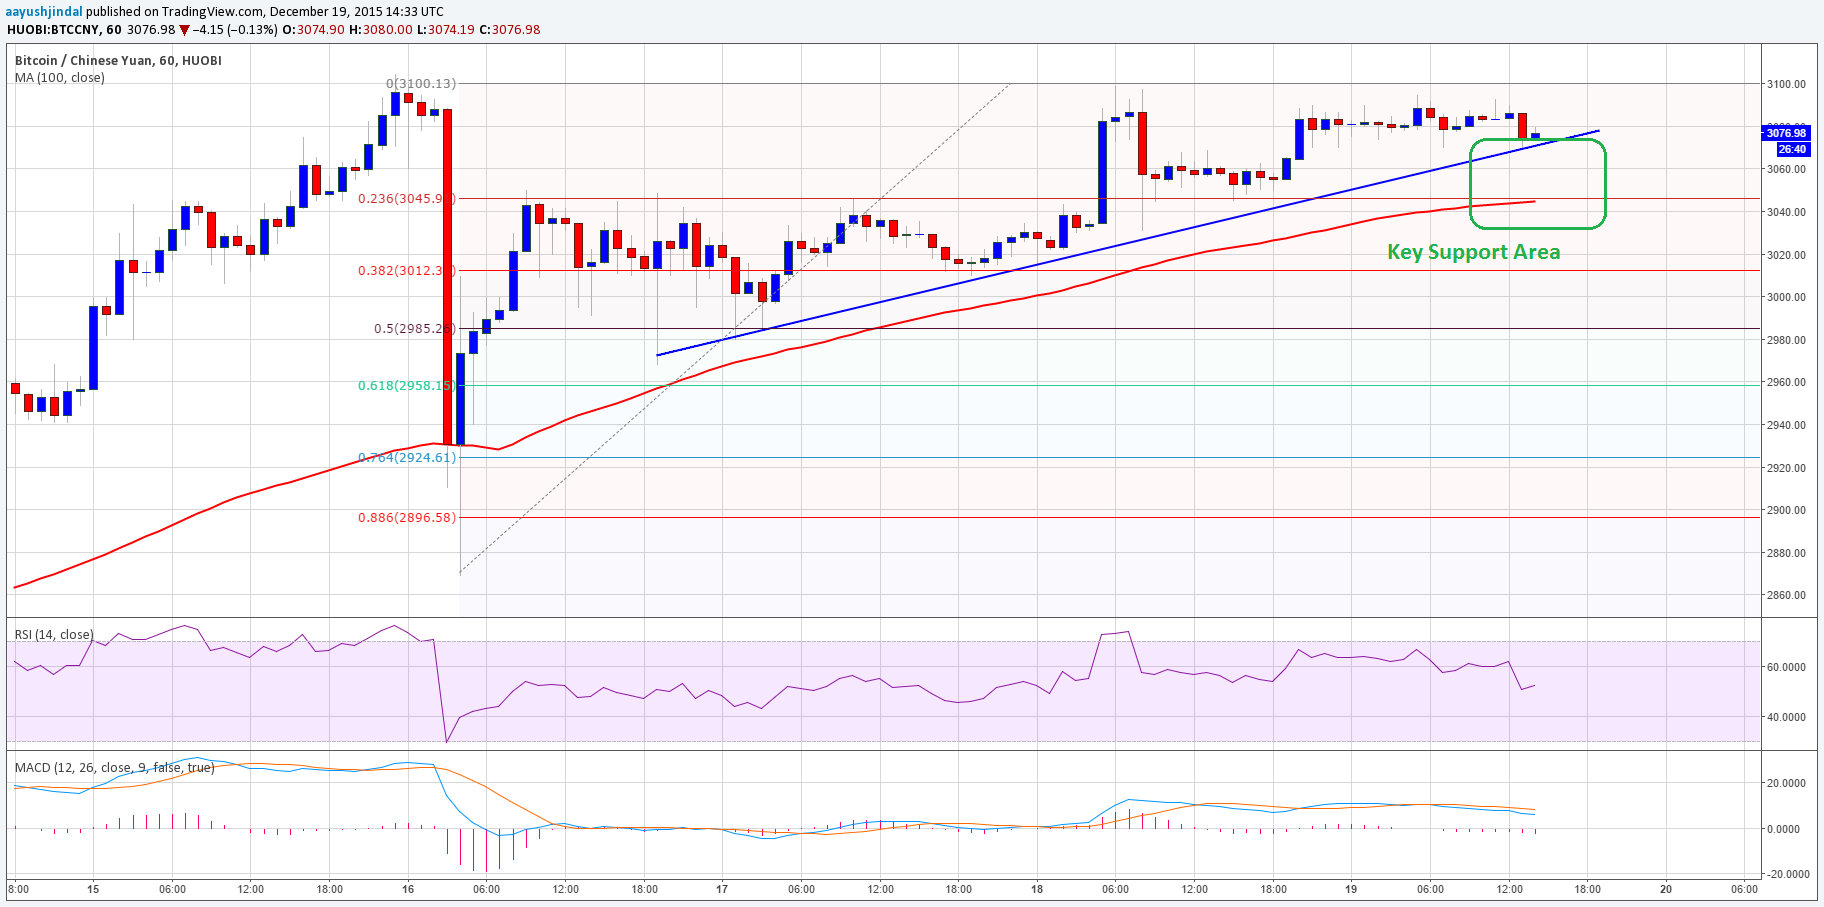
When we analyze the hourly chart with the data feed from Huobi, there is another support trend line formed. It looks like the price may break it and trade towards the 38.2% Fibonacci retracement level of the last wave from the ¥2870 low to ¥3100 high.
Looking at the Indicators
4H MACD – The moving average convergence divergence is under convergence, and it would be interesting to see if there is a rise in buyer’s sentiment.
4H RSI – The 4-hour relative strength index is above the 50 level with no signs of weakness.
Intraday support level – ¥3000
Intraday resistance level – ¥3100
Charts from BTCChina and Huobi; hosted by Trading View