
Reason to trust
How Our News is Made
Strict editorial policy that focuses on accuracy, relevance, and impartiality
Ad discliamer
Morbi pretium leo et nisl aliquam mollis. Quisque arcu lorem, ultricies quis pellentesque nec, ullamcorper eu odio.
Key Highlights
- Bitcoin’s price traded higher this past week, but it looks like it is finding offers once again near ¥2490-2500.
- There is a chance of a triple top pattern on the hourly chart (price feed from Huobi), which may ignite a short-term downside move.
- The price looks in an uptrend, as there is an ascending channel formed on the daily time frame chart (data feed from BTCChina).
Bitcoin’s price is facing a tough barrier near the last high of ¥2490-2500, so it would be interesting to see whether it can manage to break it or not moving ahead.
Short-term Correction?
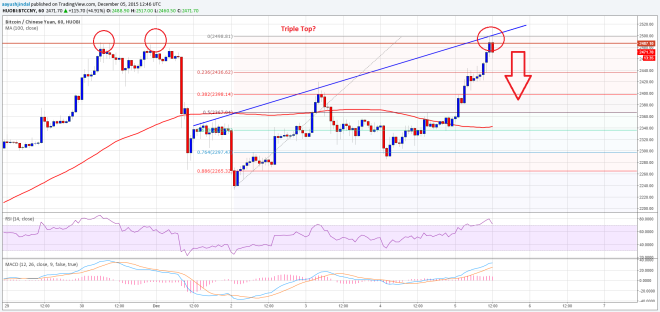
There was a decent ride towards the upside in Bitcoin’s price, as it moved above the 100 hourly simple moving average (data feed from Huobi). However, the price is currently trading near the last swing high of ¥2490-2500, which is acting as a major hurdle for buyers. If the price fails to move higher above the stated level, there’s a chance of a triple top pattern.
On the downside, an initial support is around the 38.2% Fibonacci retracement level of the last leg from the ¥2230 low to the ¥2498 high. However, the most important one is around the 61.8% Fibonacci level, as the 100 hourly simple moving average is also aligned with it.
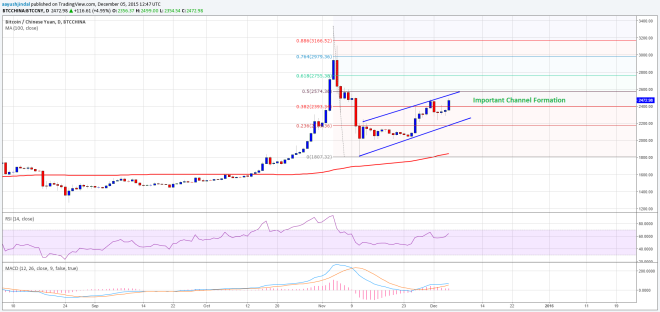
Looking at the daily time-frame chart via the data feed provided by BTCChina, it is quite clear that the price is in an uptrend. There is an ascending channel pattern formed, which may take the price higher towards ¥2550-60 where there is a possibility of sellers taking a stand.
Looking at the indicators:
Daily MACD – The MACD is in the bullish zone, pointing towards more upsides in the price.
Daily RSI (Relative Strength Index) – The Daily RSI is above the 50 level, which is a positive sign for buyers.
Intraday Support Level – ¥2400
Intraday Resistance Level – ¥2500
Charts from BTCChina and Huobi; hosted by Trading View


The last time we seen formations like this was early 2013, and we all know what happened by the end of 2013,, so expect an interesting year for Bitcoin in 2016.