Last week, bitcoin price rose from around $260 all the way upwards to print a high of around $294. We predicted during last week’s analysis a bullish run, yet we expected the bullish wave to be strong enough to push the price up to $300. The bullish wave that controlled the market last week led to a new rising support level.
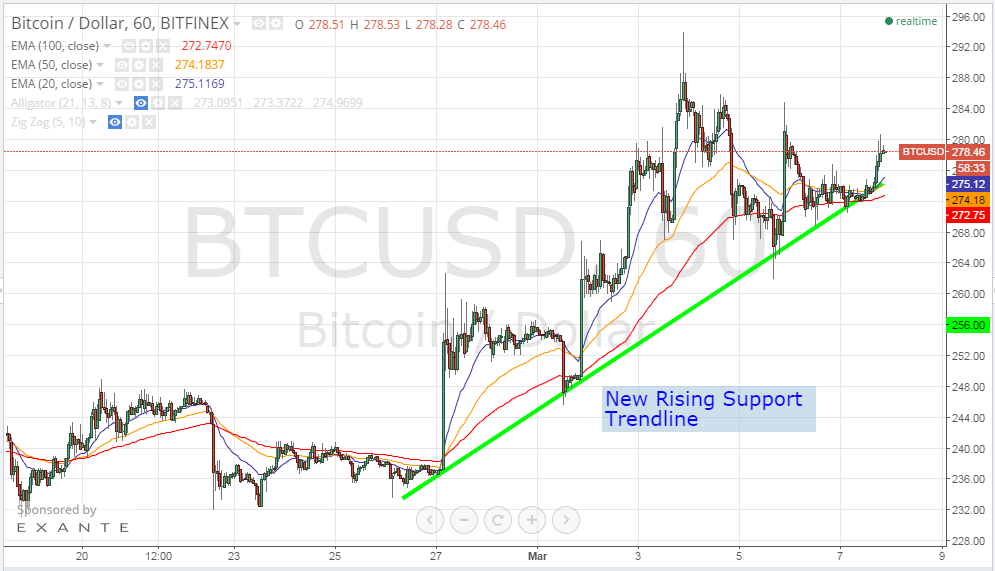
By studying the 1 hour Bitfinex (BTC/USD) charts from tradingview.com and plotting the 20, 50 and 100 period EMAs accordingly (look at the below chart), we can notice the following:
- Since the bullish wave started on the 27th of February, we have been witnessing a repetitive pattern that consists of a short lived bullish advance followed by a longer lasting downwards price correction wave that pulls the price down to 50-70% of the gained amount.
- We started to notice a rising support level as shown by the green trend line on the below chart. If the price continues to follow this rising trend line, we can see the $300 level tested within the next 3 days or so.
- The price is now above the 20, 50 and 100 period EMAs and has been so during most of last week’s trading sessions which reflects the new uptrend and denotes that we can expect bitcoin price to rise to even higher levels next week.
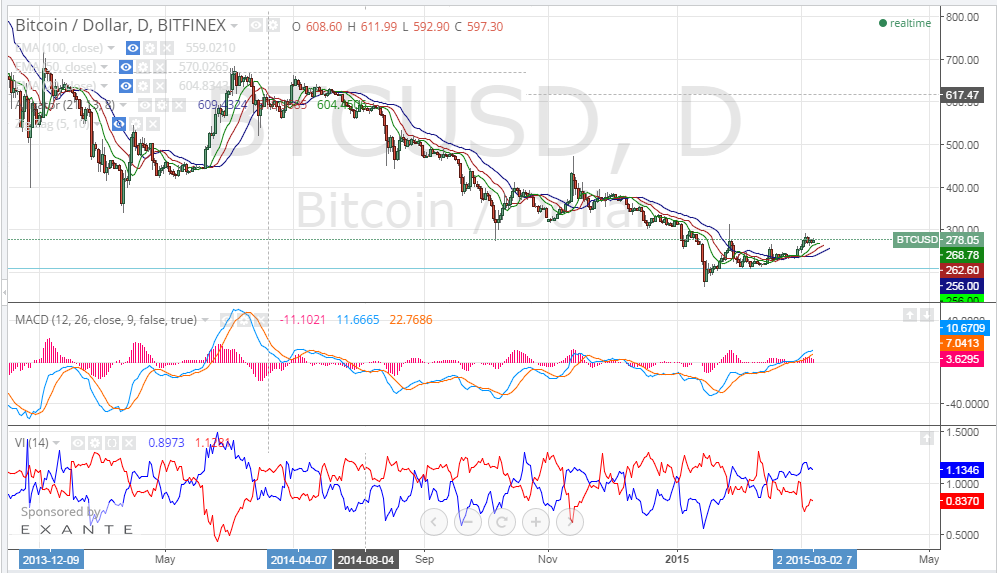
By examining the 1 day bitfinex (BTC/USD) charts, plotting the William’s Alligator indicator and calculating MACD and Vortex indicators (look at the below chart), we can conclude the following:
- The SMAs of the William’s Alligator indicator are exhibiting a bullish alignment, so it is expected to see bitcoin price rise to test the $300 resistance level during the next few days.
- MACD indicator has entered the positive territory and the blue MACD line has crossed above the red signal line which signals continuation of last week’s bullish wave.
- The Vortex Indicator is in favor of continuation of the bullish wave throughout next week as the blue uptrend line is on top of the red downtrend line and the gap between the two lines seems to be increasing.
Conclusion:
Bitcoin price increased last week and was in the $270s range during most times. Our technical analysis predicts a continuation of the bullish wave so we can see the $300 resistance level tested next week. Entering a long trade at $270 can be set to take profit at $290 with a stop loss at around $265.
Charts from bitfinex