

- BTC’s price shows strength but has struggled to break past $19,500 as the price continues to move in circles.
- BTC bounced from a low of $18,200 after the price rallied toward $19,800 but was rejected by sellers.
- The price of BTC continues to trade below 50 and 200 Exponential Moving Averages (EMA) ahead of the weekly close.
The price movement of Bitcoin (BTC) has shown some great price action lately as the price garnered momentum to bounce from a low of $18,200 to $19,800d against tether (USDT). Despite the strength shown by the price of Bitcoin (BTC), it has struggled to reclaim $19,500, which is key for a rally to the region of $20,000. Ahead of the weekly close, it is yet to be known if the price of BTC will rally to the upside or downside, as many traders are left in a dilemma. (Data from Binance)
Bitcoin (BTC) Price Analysis On The Weekly Chart

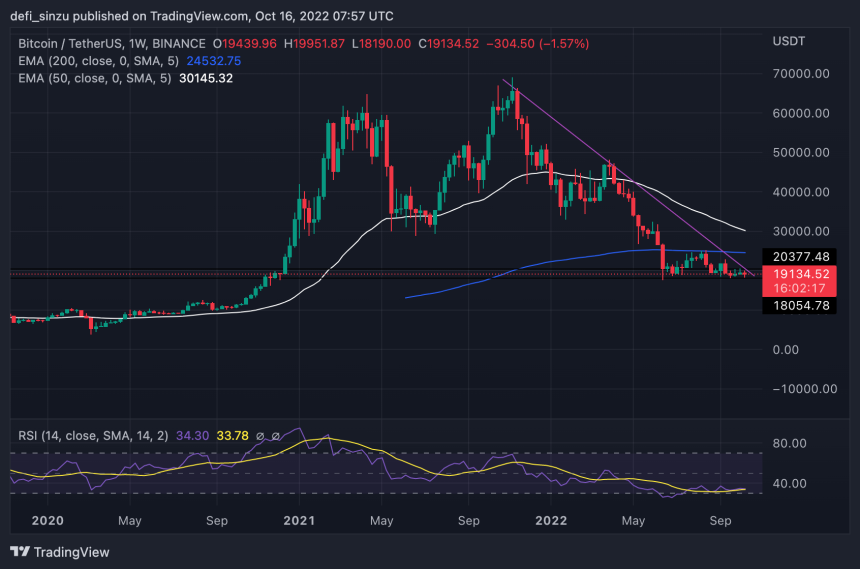
The week has been packed with so many events in the crypto space, but a notable one was the sharp decline in the crypto market after the release of the CPI news; the market appeared to be manipulated, with Bitcoin (BTC) dropping from $19,200 to $18,200 in hours and then back up to a range high of $19,800 before rejection back to $19,200. This price action seems more of manipulation with so much price volatility in a short time. With the possibility of Bitcoin Dominance (BTC.D) rising to a high of 45%, altcoins could suffer more if BTC retraces.
The price of BTC has struggled in recent times to restore the strength it showed, rallying from a region of $18,700 to $25,000. BTC’s price declined from $25,000 to a weekly low of $18,800-$19,300. The has since struggled to breakout from this range.
BTC’s price needs to reclaim $19,500 with good volume for the price to restore a measure of relief for BTC price and altcoins. If the price of BTC fails to close above $19,500, we could see the price retesting the low of $18,800-$18,200.
Weekly resistance for the price of BTC – $19,500.
Weekly support for the price of BTC – $18,800-18,200.
Price Analysis Of BTC On The Daily (1D) Chart
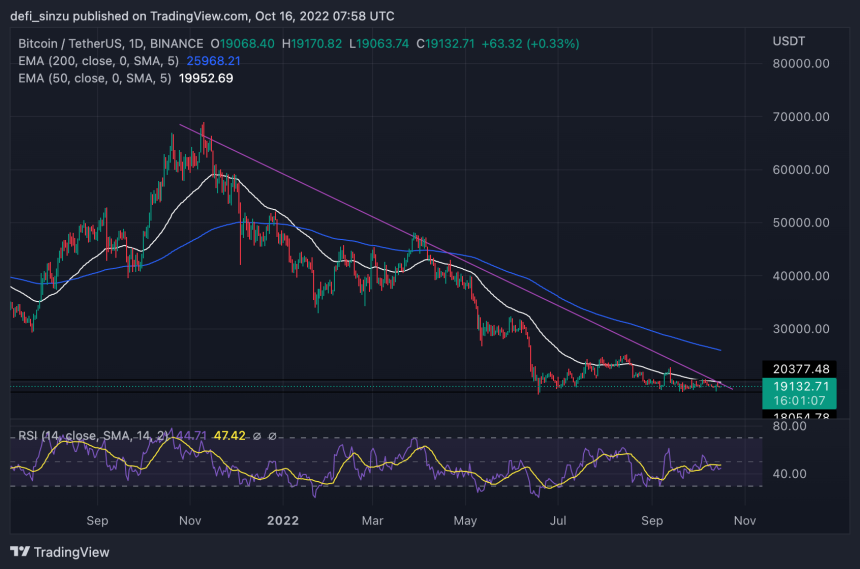
The daily timeframe for the price of BTC has been more of a struggle to
breakout from its descending triangle could spark some relief and bounce to the high of $20,500 and higher with strong buy volume.
BTC’s price trades at $19,130 as the price continues its range movement
as the price forms a descending wedge below the 50 Exponential Moving Average (EMA); the price of $20,200 corresponds to the 50 EMA, acting as resistance for the price to break higher.
Daily resistance for the price of BTC – $20,200.
Daily support for the price of BTC – $18,800.
Featured Image From NBTC, Charts From Tradingview