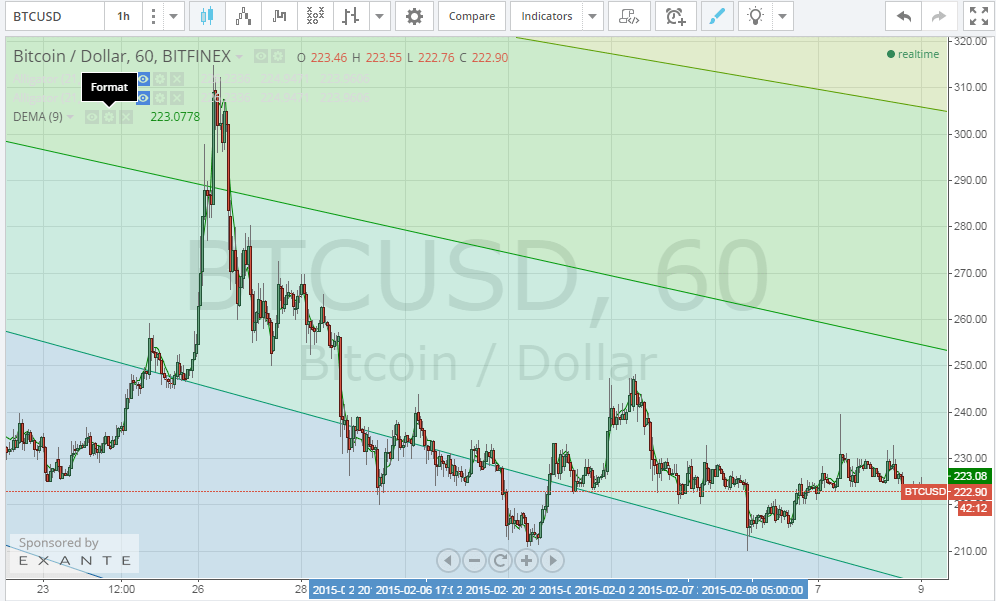
Yesterday’s bullish wave lost its momentum today and bitcoin price traded sideways with no definable trend; however, it remained well above the $220 support level throughout all of today’s trading sessions.
The bitcoin market’s trading pattern pulled the price down from $229 to around $221 before rising up again to reach $224 at the time of the writing of this article. By plotting the Fibonacci retracement fan along a trend line that extends between the high reached on the 13th of November ($475) and the low reached on the 14th of January ($164), as we did on our analysis on the 19th of January, and then extending the fan lines through the 1 hour Bitfinex (BTC/USD) charts from tradingview.com (look at the below chart), we can see the price now trading between the 62% and 50% retracement fan levels. As proven by our analysis during the past couple of days, it’s clear that bitcoin price is endorsed by 2 support levels, $200 and $220, which appear to resist a decline during the upcoming days.
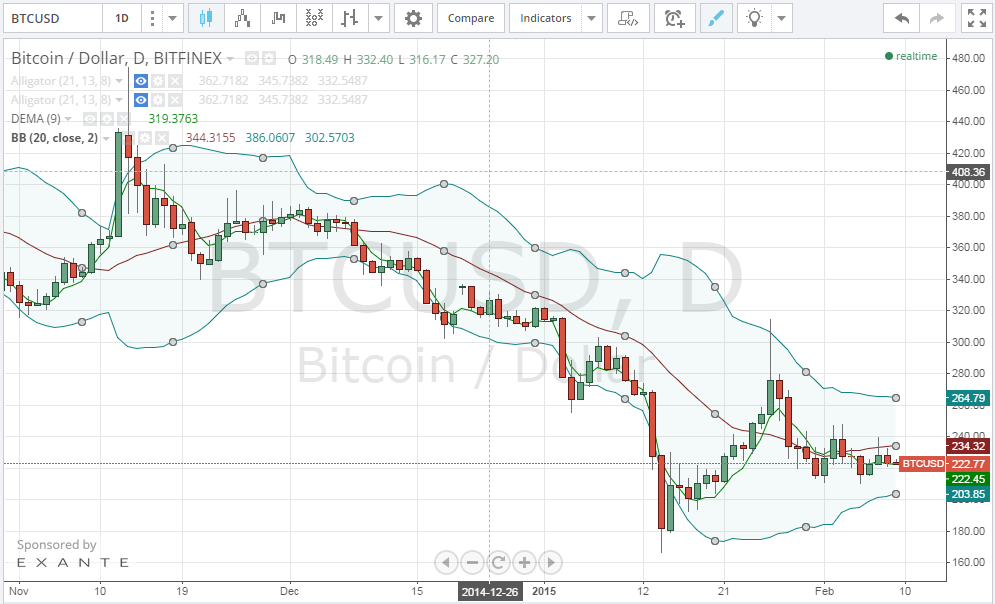
By plotting the Bollinger bands on the 1 day Bitfinex (BTC/USD) charts from tradingview.com using the 20 day exponential moving average EMA (look at the below chart), we can notice the following:
- The gap between the standard deviations of the 20 day EMA is wide, which reflects the bitcoin market’s high volatility at the moment.
- The price is currently below the 20 day EMA and is likely to touch the lower standard deviation before bitcoin price starts rising again.
- The upper target to the upcoming bullish wave is around $264 level, which is close to the $256 resistance level according to Fibonacci retracement fan levels.
Conclusion:
Yesterday’s bullish advance failed to continue today. As bitcoin price is rising, it is normal to see sideways movement following bullish waves. According to our technical analysis, bitcoin price will most probably continue rising up tomorrow and we will see it at the $256 resistance level soon.
Charts from Bitfinex.