

- Bitcoin price climbed into a crucial uptrend after it broke the $4,200 resistance against the US Dollar.
- The price surged higher and broke the $4,500 and $5,000 resistances before starting a downside correction.
- There is a significant ascending channel formed with support at $4,900 on the 4-hours chart of the BTC/USD pair (data feed from Kraken).
- The pair remains well supported on dips and buyers are likely to push the price to a new 2019 high.
Bitcoin price gained bullish momentum recently above $5,000 against the US Dollar. BTC is following a solid uptrend and it is likely to climb towards the $5,400 and $5,600 levels.
Bitcoin Price Weekly Analysis (BTC)
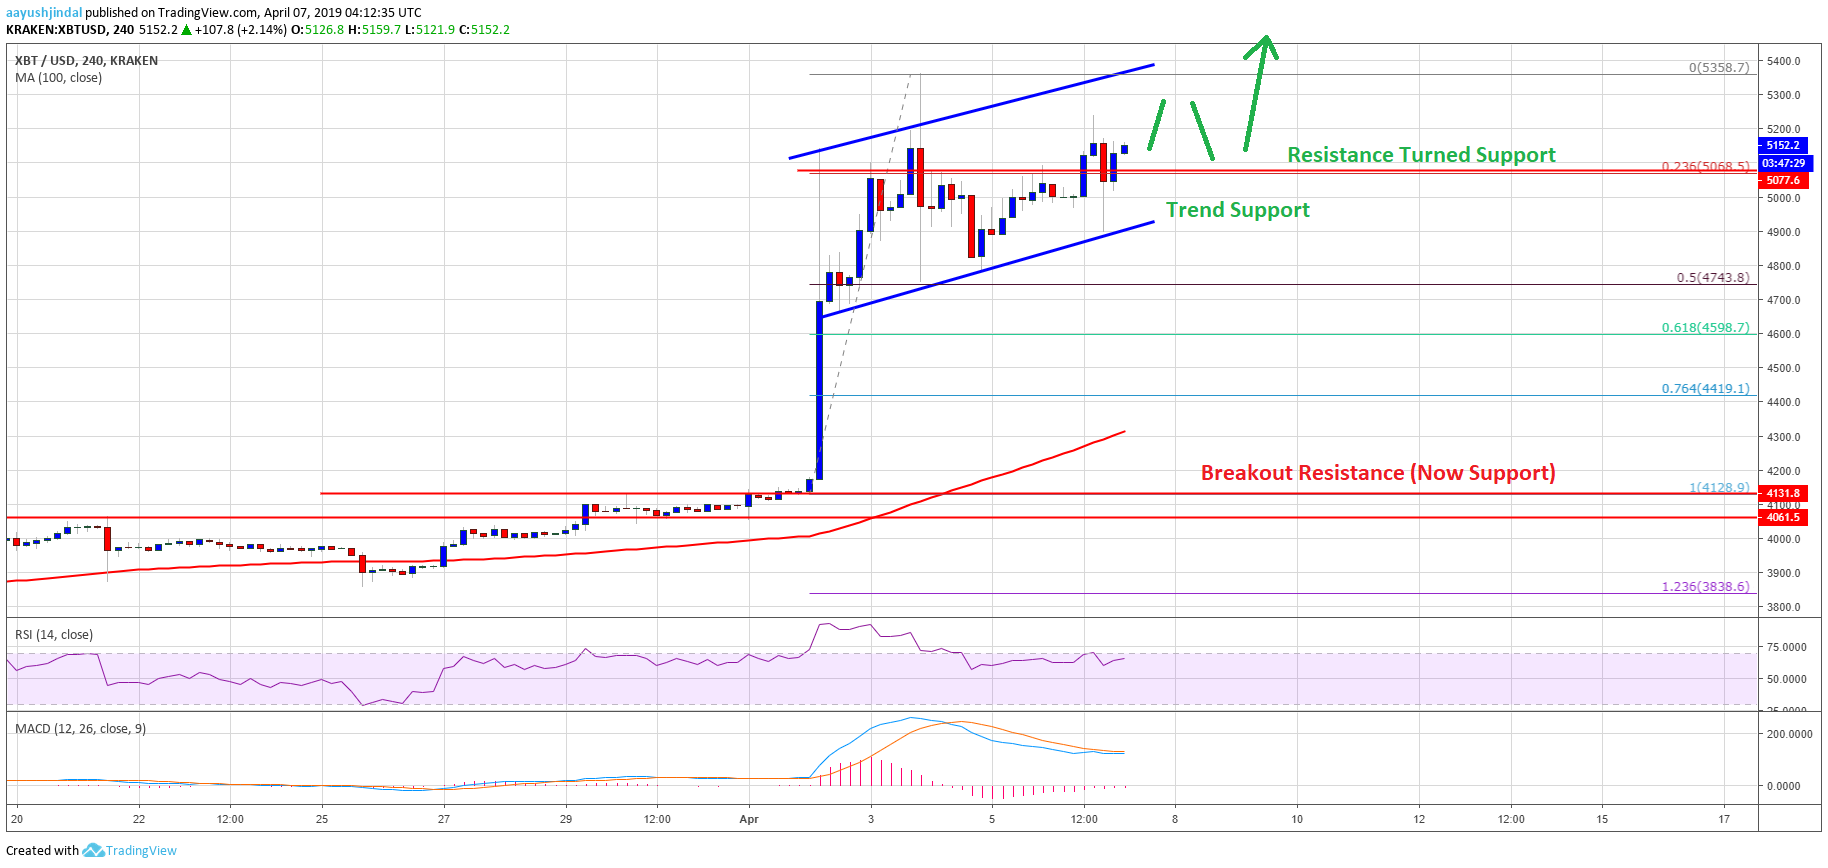
This past week, bitcoin started a strong rise after it broke the $4,200 resistance price against the US Dollar. The BTC/USD pair climbed above many resistance levels, including $4,400, $4,600 and $4,800. Buyers were even successful in a break above $5,000, plus a close above the 100 simple moving average (4-hours). The price traded above the $5,200 level and a new 2019 high was formed at $5,358. Later, the price started a downside correction and traded below $5,200 and $5,000.
There was a break below the 50% Fib retracement level of the last wave from the $4,128 low to $5,358 high. However, the decline was limited and the price found support near the $4,750 level. The 50% Fib retracement level of the last wave from the $4,128 low to $5,358 high also acted as a strong support. Recently, the price started a fresh increase and moved above the $5,000 and $5,100 resistance levels, which is a positive sign.
At the outset, there is a significant ascending channel formed with support at $4,900 on the 4-hours chart of the BTC/USD pair. The pair is likely to continue higher since it recently broke the $5,060 resistance level. To the topside, the price is likely to break the $5,358 high. The next stop could be $5,400, above which bitcoin is likely to surge towards the $5,600 resistance level in the near term.

Looking at the chart, BTC price is clearly trading in a solid uptrend above the $4,900 support area. If there is a downside extension below $4,900, the price might revisit the $4,750 support level. The next major support is at $4,500, where buyers are likely to take a stand. In the short, there could be range moves before the price climbs towards the $5,400 or $5,600 level.
Technical indicators
4 hours MACD – The MACD for BTC/USD is about to move into the bullish zone.
4 hours RSI (Relative Strength Index) – The RSI for BTC/USD is placed well above the 55 level.
Major Support Level – $4,900
Major Resistance Level – $5,400