

Key Highlights
- Dogecoin price made one more attempt to go pass 60.0 Satoshis, but failed as there was a lack of momentum.
- A crucial double top pattern might be forming, which can push Dogecoin prices lower in the short term.
Buyers managed to take advantage recently and pushed prices of Doegoin higher, but it looks like there is a topping pattern in making that could ignite a short-term correction.
Double Top Pattern
There was a sharp reaction noted around 50.0-50.6 Satoshis, which took the price back higher. An important level of 60.0 Satoshis was almost tested where Dogecoin failed once before. The mentioned failure raised the probability of a double top pattern on the hourly chart. 60.0 Satoshis holds a lot of significance and if the pattern is valid, we can witness a sharp decline in prices moving ahead.
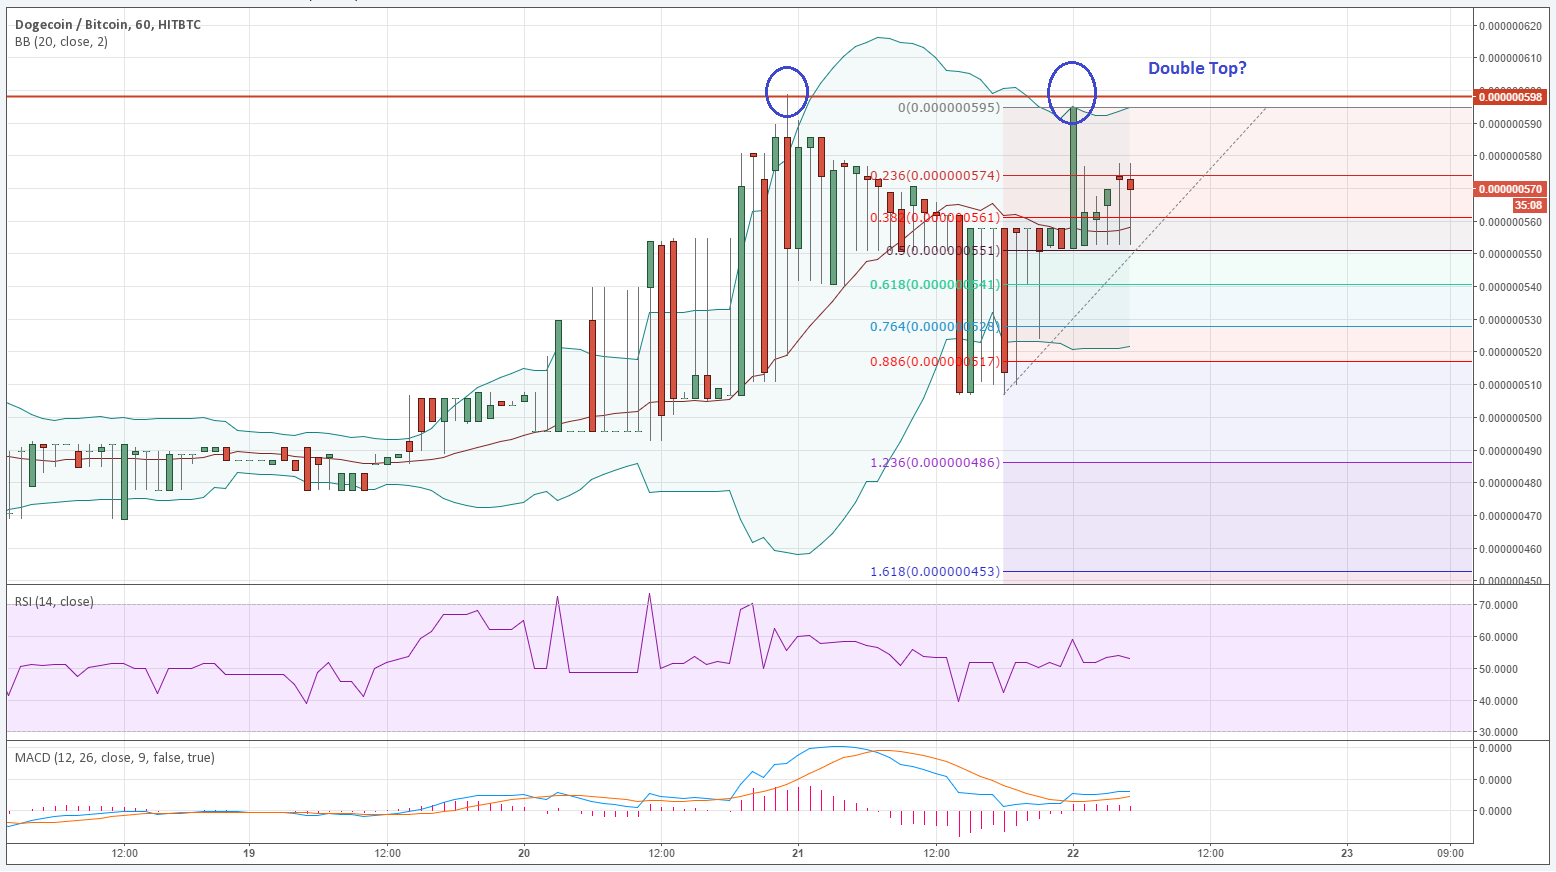
The price also tested the Upper Bollinger Band, so it can be considered as a perfect failure. A break below the Middle Bollinger Band might ignite more losses, which could take the price towards 52.0 Satoshis. However, if the double top pattern takes shape, then the wave duplication might push the price towards 48.0 Satoshis. The mentioned level is very crucial, as it represents a major swing area. Buyers may well take a stand around 48.0 Satoshis if prices decline.
Yesterday, we highlighted that buyers may perhaps make one attempt to retest 60.0 Satoshis, but it won’t be easy for them to take prices above it. Moving ahead, there are chances of ranging moves as long as the price is below 60.0 Satoshis.
Intraday Support Level – 54.0 Satoshis
Intraday Resistance Level – 60.0 Satoshis
It looks like the hourly RSI might settle below the 50 level, which may perhaps encourage sellers. We need to see how long buyers can hold, as there are a lot of bearish signs developing.
Charts courtesy of Trading View