Key Highlights
- Ethereum price continued to stay in the bullish zone vs the US Dollar, and may be setting up for the next break.
- Yesterday’s highlighted bullish trend line on the hourly chart (data feed via Kraken) of ETH/USD acted as a support and held the downside move as forecasted.
- There is now a minor bearish trend line formed on the same chart, which might provide us the next break in ETH/USD.
Ethereum price after a minor dip vs the US dollar moved higher. ETH looks like poised for yet another run towards the $14.50 level.
Ethereum Price – Trend Line Break
Ethereum price ETH managed to find bids intraday and moved a few points’ higher vs the US Dollar. Yesterday, I highlighted a bullish trend line on the hourly chart (data feed via Kraken) of ETH/USD, and was expecting it to act as a support area. The trend line did act as a barrier for the sellers and prevented a downside move. The price is now moving higher, and may be approaching a break in the near term.
Currently, there is another trend line formed on the same chart on the upside, which is acting as a resistance for more gains. If the ETH bulls manage to break it, then a move towards the last swing high of $14.40 is possible. The price may even test the $14.50 level if sellers fail to protect the upside move.
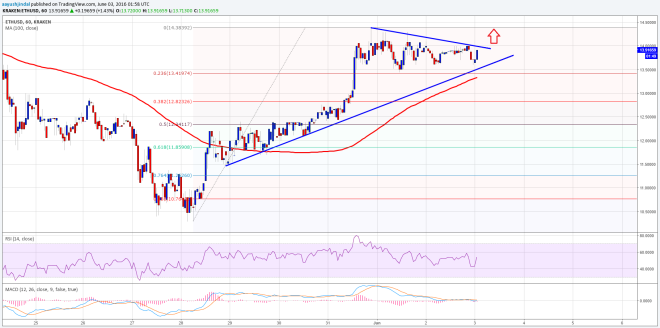

I would suggest to wait for a break if you are looking to trade ETH/USD, and then plan for a trade. The price is above the 100 hourly simple moving average, which is a positive sign and may lift the market sentiment in the short term.
Hourly MACD – The MACD is almost flat, and pointing towards a break moving ahead.
Hourly RSI – The RSI just moved above the 50 level, calling for more gains in ETH.
Intraday Support Level – $13.50
Intraday Resistance Level – $14.10
Charts courtesy of Kraken via Trading View