Key Highlights
- ETH price after declining towards $9.44 against the US Dollar found support.
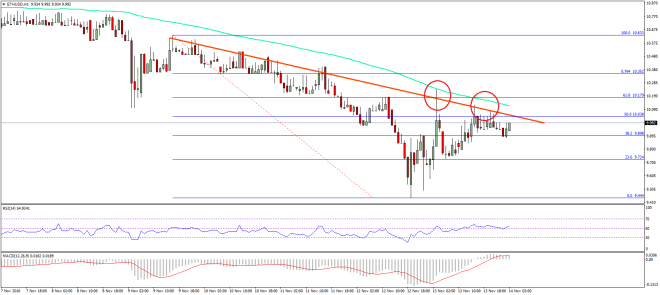
- The price is currently recovering, and facing sellers near a bearish trend line formed on the hourly chart (data feed via SimpleFX) of ETH/USD.
- The ETH buyers need an encouragement in gaining strength to overcome hurdles on the upside.
Ethereum price is currently attempting to recover against the US Dollar as ETH/USD faces a major hurdle on the upside at $10.10.
Ethereum Price Resistance
This past week we saw how there was a decline in ETH price from the $10.80 level to $9.50 area against the US Dollar. Over the weekend, there was a consolidation phase, as the ETH/USD pair started a minor recovery. During the correction phase, it settled above the 23.6% Fib retracement level of the decline from the $10.63 high to $9.44 low, and currently facing as a major resistance.
There are a couple of important hurdles aligned at $10.05-10 levels, acting as a solid resistance. First, there is a bearish trend line formed on the hourly chart (data feed via SimpleFX) of ETH/USD. Second, the 38.2% Fib retracement level of the decline from the $10.63 high to $9.44 low is positioned. Lastly, the 100 hourly simple moving average is also just above the trend line. So, we can say that the $10.05-10 is a major breakout zone for the ETH price.

We need to see if there can be a break above it or not. If the ETH buyers succeed in breaking the mentioned resistance area, then it would open the doors for a further recovery. On the upside, the next resistance in that case may be around the $10.50 level.
Hourly MACD – The MACD has changed the slope from the bearish to bullish zone.
Hourly RSI – The RSI has also moved above the 50 level, which is a positive sign.
Major Support Level – $10.10
Major Resistance Level – $10.50
Charts courtesy – SimpleFX