Key Highlights
- Ethereum price after a decline against the US Dollar started a consolidation below a major resistance area.
- There is a bearish trend line formed on the hourly chart (data feed via Kraken) of ETH/USD, which can be seen as a major barrier for an upside move.
- The price is below the 100 hourly simple moving average, which is also acting as a resistance zone.
Ethereum price after weakening started trading in a range. It looks like it is facing a tough resistance on the upside, which is stalling gains.
Ethereum Price Resistance
Ethereum price ETH after moving a few points below the $10.00 level against the US Dollar found bids, and started to correct higher. However, the ETH/USD pair is facing a major resistance on the upside, which is preventing the price to gain further. An initial resistance is around the 100 hourly simple moving average, which is acting as a hurdle and stopping the bulls from taking ETH higher.
However, the most important barrier for the bulls is around a bearish trend line formed on the hourly chart (data feed via Kraken) of ETH/USD. The highlighted trend line and resistance acted as a resistance earlier and can continue to stop gains in the short term. As long as the price is below the trend line, there are chances of more downsides.
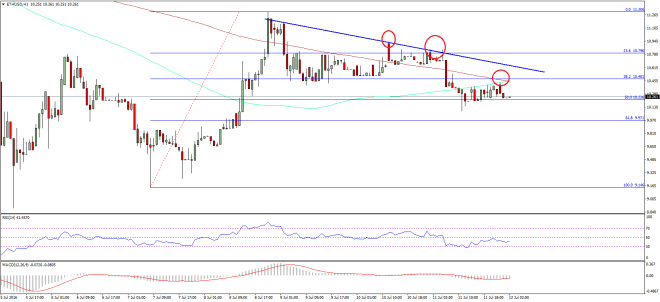

An initial support on the downside is at 50% Fib retracement level of the last leg from the $9.14 low to $11.30 high. If the ETH bears manage to gain strength, then a move towards the 61.8% Fib retracement level of the same leg is possible in the short term.
Hourly MACD – The MACD is in the bearish zone, calling for more downsides moving ahead.
Hourly RSI – The RSI has moved below the 50 level, which is not a good sign for people looking for buy ETH.
Major Support Level – $10.00
Major Resistance Level – $10.50
Charts courtesy – SimpleFX