

Key Highlights
- ETH price struggled to remain above the $455-460 support area against the US Dollar.
- There was a break below yesterday’s highlighted key contracting triangle with support at $458 on the hourly chart of ETH/USD (data feed via SimpleFX).
- The pair is now below $455 and the 100 hourly simple moving average, which is a short-term bearish sign.
Ethereum price traded lower against the US Dollar and Bitcoin. ETH/USD is now below the $455-460 support and is under bearish pressure.
Ethereum Price Resistance
Yesterday, buyers fails to hold gains in ETH price above the $460 support area against the US Dollar. The price started a downside move and broke a few important support levels such as $460, $458 and $450. First, there was a break of the 23.6% Fib retracement level of the last upside wave from the $391 low to $480 high. It opened the doors for more losses below $460 and the price moved below the 100 hourly simple moving average.
More importantly, there was a break below yesterday’s highlighted key contracting triangle with support at $458 on the hourly chart of ETH/USD. The pair is currently attempting a break of the 38.2% Fib retracement level of the last upside wave from the $391 low to $480 high. Once there is a break below the $445 level, there can be further declines in the near term towards $435. The next major support is around the 50% Fib retracement level of the last upside wave from the $391 low to $480 high around $435.
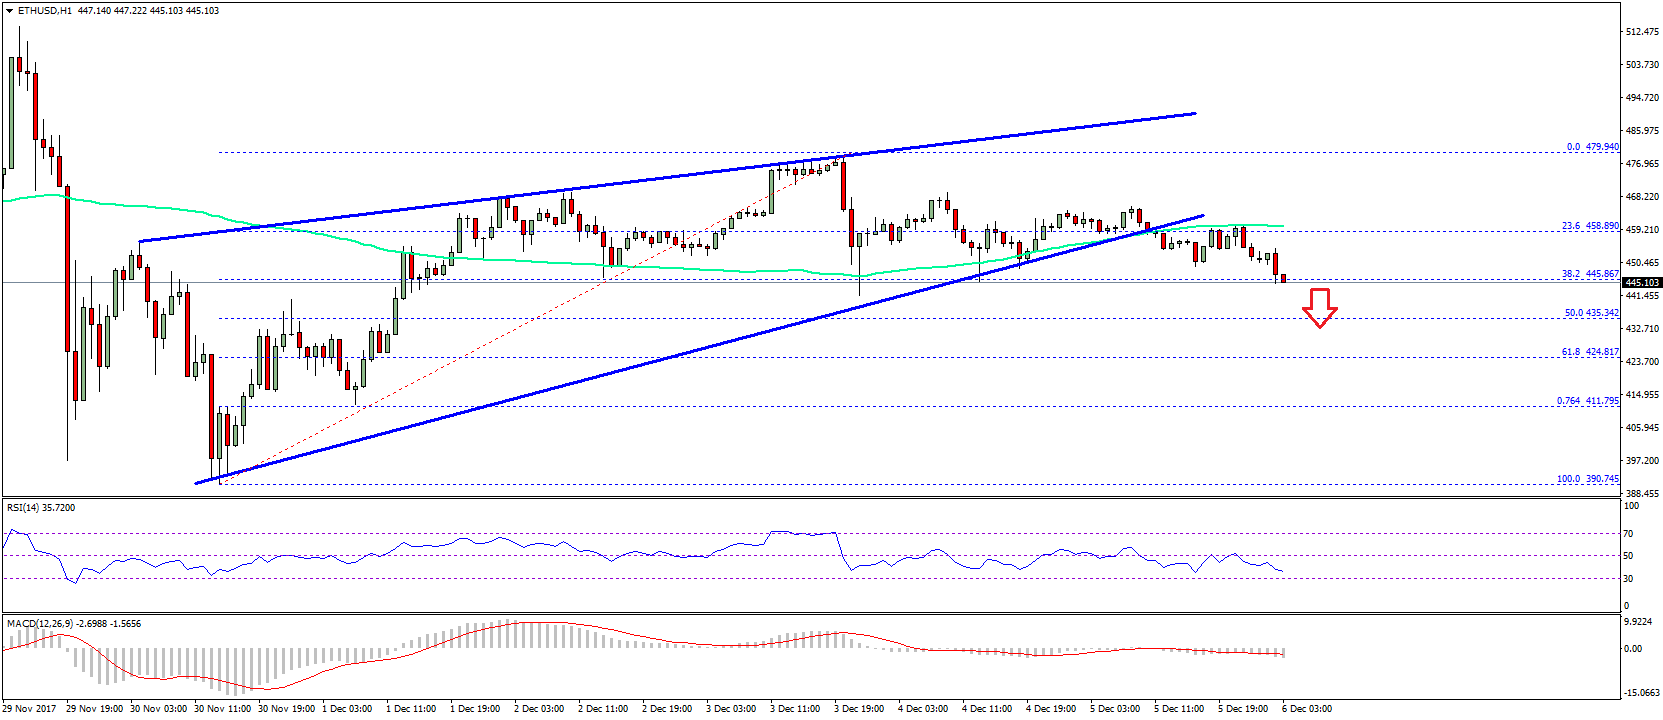
On the upside, the broken support at $458-460 and the 100 hourly SMA might now act as a resistance. Overall, more losses likely as long as the price is below $460.
Hourly MACD – The MACD is gaining pace in the bearish zone.
Hourly RSI – The RSI is now well below the 50 level and is eyeing the 30 level.
Major Support Level – $435
Major Resistance Level – $460
Charts courtesy – SimpleFX