

Key Highlights
- ETH price started a downside correction after trading towards $830 against the US Dollar.
- There was a break below a key bullish trend line with support at $805 on the hourly chart of ETH/USD (data feed via Kraken).
- The pair may correct a few points further, but it may find support near the $725-730 zone.
Ethereum price is correcting lower against the US Dollar and Bitcoin. ETH/USD remains supported above the $725 level, which is also a pivot zone.
Ethereum Price Resistance
There were solid gains in ETH price above $800 this past week against the US Dollar. The price traded above the $830 level before it faced a strong resistance. Later, a downside correction was initiated and the price declined below the $800 and $780 support levels. There was also a break below the 23.6% Fib retracement level of the last wave from the $664 low to $833 high.
More importantly, there was a break below a key bullish trend line with support at $805 on the hourly chart of ETH/USD. The pair even traded below the $760 level and settled below the 100 hourly simple moving average. At the moment, the price is testing the 50% Fib retracement level of the last wave from the $664 low to $833 high. It could either bounce back or correct further towards the $725 support zone. The $725-730 area is significant and it will most likely prevent further losses in the near term.
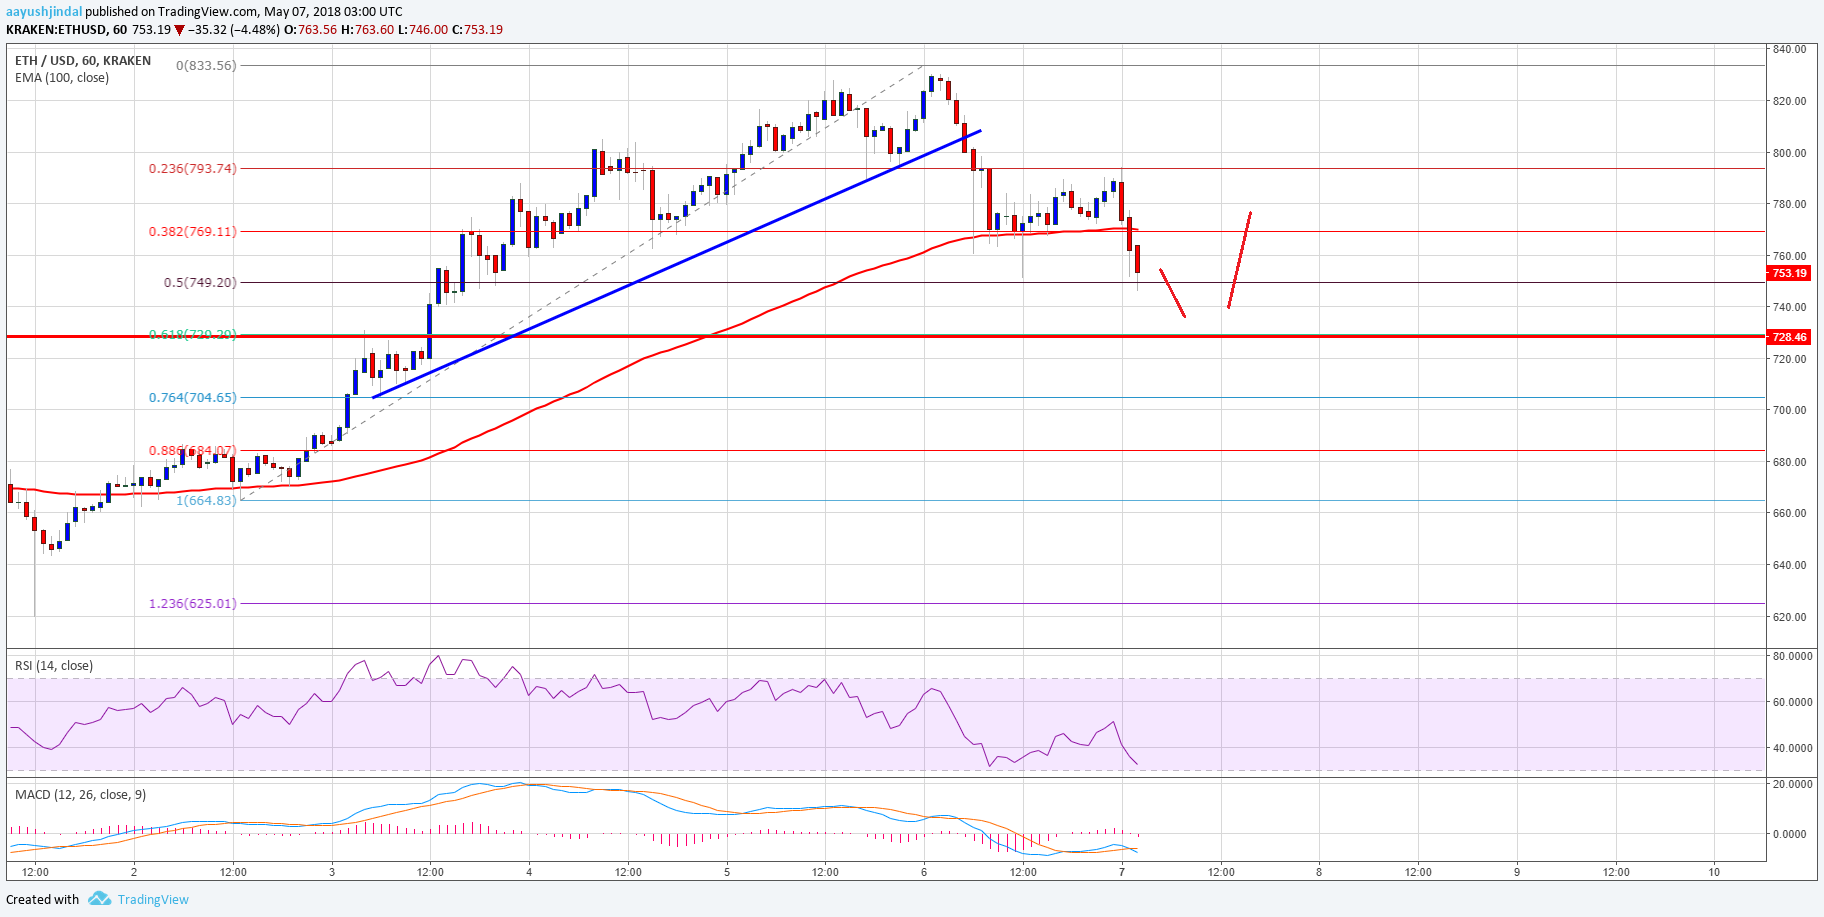

Looking at the chart, the price is currently in a correction phase below $800. However, it must stay above the $725 support to avid an increase in selling pressure. On the upside, an initial resistance is at $760. Having said that, a break above the $770 level and the 100 hourly SMA is needed for the price to gain traction.
Hourly MACD – The MACD is now in the bearish zone.
Hourly RSI – The RSI is currently approaching the 30 level.
Major Support Level – $725
Major Resistance Level – $770