Key Highlights
- ETH price is correcting lower and is currently trading near a major support at $326 against the US Dollar.
- Yesterday’s highlighted major bullish trend line with current support at $326 is intact on the hourly chart of ETH/USD (data feed via SimpleFX).
- The price should hold the trend line support near $326 to remain in the bullish zone.
Ethereum price is correcting lower against the US Dollar and Bitcoin. ETH/USD has to maintain bid tone above $326 to gain upside momentum.
Ethereum Price Support
There was a new minor high formed at $337.29 in ETH price against the US Dollar. Later, the price started correcting lower and moved below $335. There was a break below the 23.6% Fib retracement level of the last leg up from the $314.44 low to $337.29 high. The downside correction was decent since the price even broke the $326 level once before recovering.
It tested the 61.8% Fib retracement level of the last leg up from the $314.44 low to $337.29 high. The $323 level held the downside move along with yesterday’s highlighted major bullish trend line with current support at $326 on the hourly chart of ETH/USD. The highlighted trend line support could play an important role near $326 in the short term. Therefore, the pair has to remain above $326 and $323 to avoid further declines.
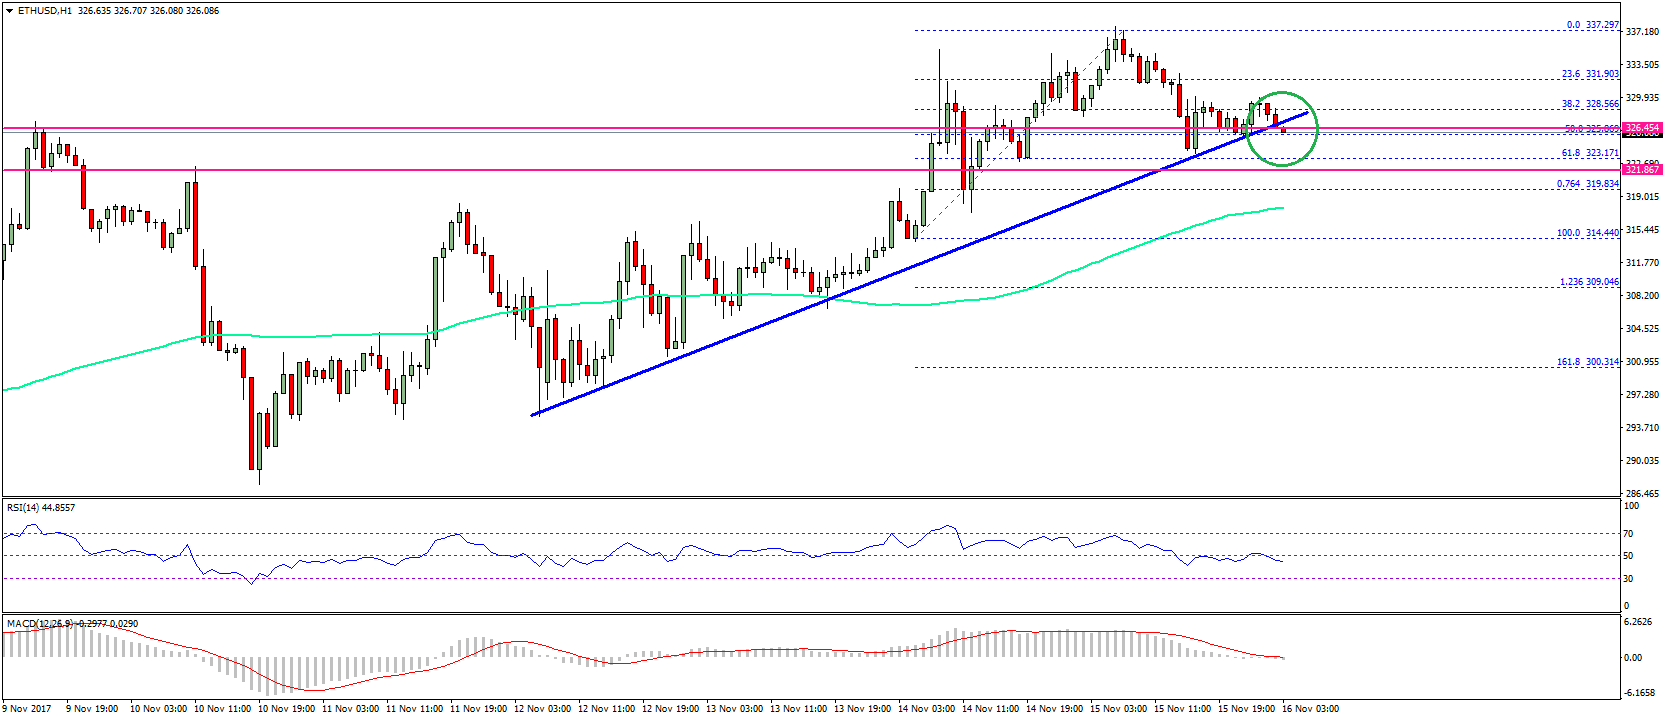
On the upside, the $335 level is an initial resistance followed by the recent high at $337.29. A close above $337.29 could open the doors for more gains may be toward $360 in the near term. The 100 hourly simple moving average is currently positioned at $318 and is showing positive signs. If the price continues to stay above the $323 level, there is a chance of it gaining momentum.
Hourly MACD – The MACD has reduced most of its bullish slope.
Hourly RSI – The RSI has just moved below the 50 level.
Major Support Level – $323
Major Resistance Level – $337
Charts courtesy – SimpleFX