

Key Highlights
- Ethereum price continued to stay under a bearish pressure vs the US Dollar, and may trade a few points lower.
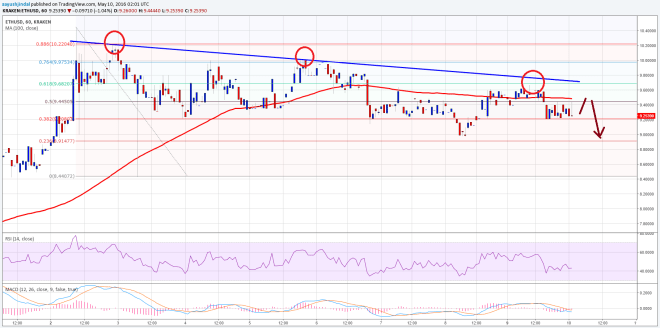
- Yesterday’s highlighted bearish trend line formed on the hourly chart (data feed via Kraken) of ETH/USD continued to act as a resistance.
- The price is now below the 100 hourly simple moving average, which may ignite a downside reaction.
Ethereum price attempted a break yesterday, but failed. It looks like ETH/USD bears may step in to take the price towards $9.00.
Ethereum Price – Downside Reaction?
Ethereum price ETH traded above the 100 hourly simple moving average for some time, but failed to gain traction. As a result, the price moved down, and there was even a close below the 100 hourly SMA. I highlighted a bearish trend line formed on the hourly chart (data feed via Kraken) of ETH/USD yesterday, and was hoping for a break.
However, the ETH bulls failed to break the trend line resistance, and the price moved down. Now, since there is an hourly close below the 100 SMA, it increases the chance of ETH/USD moving down a few points in the short term. Please note, I am not saying it will fall and decline heavily. I mean there may be a move down towards $9.00 if the price remains under a bearish pressure, as there was a failure near the 61.8% Fibonacci retracement level of the last drop from the $10.40 high to $8.40.

If you are looking to sell, then consider it as long as the price is below the 100 hourly SMA. A close back above it may again put ETH on a bullish path.
Hourly MACD – The MACD might change the slope to the bullish area, but there is a no major sign yet.
Hourly RSI – The RSI is below the 50 level, which is a bearish sign in the short term.
Intraday Support Level – $9.00
Intraday Resistance Level – $9.50
Charts courtesy of Kraken via Trading View
Header Image: NewsBTC