

Key Highlights
- Ethereum price remained under a bearish pressure vs the US Dollar, and it looks like it may create a new weekly low moving ahead.
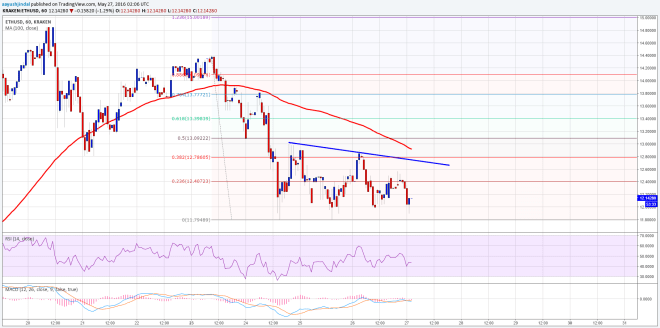
- There is a minor bearish trend line formed on the hourly chart (data feed via Kraken) of ETH/USD, which is acting as a hurdle for an upside move.
- A break below the recent low of $11.79 may call for a test of the $11.20 level in the short term.
Ethereum price looks like may struggle in the near term vs the USD, and if the ETH sellers step in, then a new weekly low may be established.
Ethereum Price Bearish
Ethereum price ETH may be setting up for more losses in the short term vs the US Dollar, as it failed to move higher intraday. The price moved closer to the $12.80 where it found sellers and started to trade lower once again. There is a minor bearish trend line formed on the hourly chart (data feed via Kraken) of ETH/USD that acted as a resistance and pushed the price down.
The price is currently trading close to the last swing low of $11.79, and if the ETH sellers manage to break it, then a move towards the next support area of $11.20 is possible in the short term. On the upside, an initial resistance is around the 23.6% Fib retracement level of the last drop from the $14.40 high to $11.79 low. However, the most important one is around the trend line resistance, as the 100 hourly simple moving average along with the 38.2% Fib retracement level of the same wave is around it.

If you are looking to enter a sell trade, then have a stop above the 100 SMA.
Hourly MACD – The MACD is in the bearish zone, pointing towards a bearish pressure.
Hourly RSI – The RSI is below the 50 level, which is a bearish sign.
Intraday Support Level – $11.79
Intraday Resistance Level – $12.80
Charts courtesy of Kraken via Trading View
Image Header NewsBTC