

Key Highlights
- Ethereum price did not stop climbing against the US Dollar Intraday, and moved above the $14.00 level.
- My yesterday’s idea of buying dips worked perfectly, and if you entered a trade, then I suggest to book partial profits.
- Also, yesterday’s highlighted bullish trend line formed on the hourly chart (data feed via Kraken) of ETH/USD continued to act as a support area.
Ethereum price moved further higher, and buying dips played well. Now, can ETH/USD continue trading higher and test $15.00 once again?
Ethereum Price To Move Further Higher?
There was no stopping Ethereum price ETH, as it continued to rocket higher vs the US Dollar. There was a nice upside move above the $14.00 level and the price traded as high as $14.29. Yesterday, I stated that buying dips can be considered. It did work perfectly, as the price bounced from the highlighted bullish trend line formed on the hourly chart (data feed via Kraken) of ETH/USD.
Moreover, the price after trading as high as $14.29 corrected once and already tested the 38.2% Fib retracement level of the last wave from the $10.00 low to $14.29 high. So, it may again continue to move higher and trade towards the last swing high of $14.29. There is even a chance that the price may break the stated level and attempt to test the all-important $15.00 level.
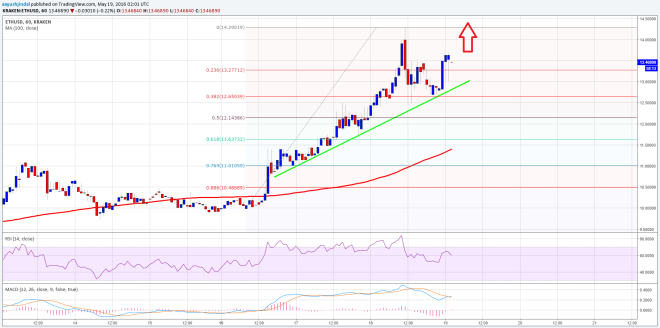

I think once again buying dips can be considered as long as the price is above the highlighted trend line and support area. There is no sign of a divergence on the hourly RSI, which means currently there is no sign of a down move.
Hourly MACD – The MACD is about to change the gears to the bullish slope, calling for more gains.
Hourly RSI – The RSI is above the 50 level, which is a positive sign for the ETH bulls.
Intraday Support Level – $13.10
Intraday Resistance Level – $14.25
Charts courtesy of Kraken via Trading View
Header Image via NewsBTC