Key Highlights
- Ethereum price started to move down against the US Dollar, and it looks like there may be more losses in the short term.
- Yesterday’s highlighted bearish trend line on the hourly chart (data feed via Kraken) of ETH/USD continued to play a major role for a downside move.
- The 100 hourly simple moving average is bending down, which is not a good sign for the ETH bulls.
Ethereum price may face more selling pressure in the short term, as the highlighted resistance area is turning out to be a major barrier for ETH.
Ethereum Price Losses
Ethereum price ETH continued to face offers on the upside against the US Dollar, and started moving down. There is a monster resistance area on the upside for ETH, as highlighted in yesterday’s post acting as a hurdle for more gains.
There is a bearish trend line formed on the hourly chart (data feed via Kraken) of ETH/USD, which stopped gains on a number of occasions. Moreover, an initial but important resistance is also near the 100 hourly simple moving average. It is positioned below the trend line, which is a signal that the $13.00 resistance area holds a lot of value for the ETH bears. As long as the price is below the stated level, there is a chance of a downside move in the near term.
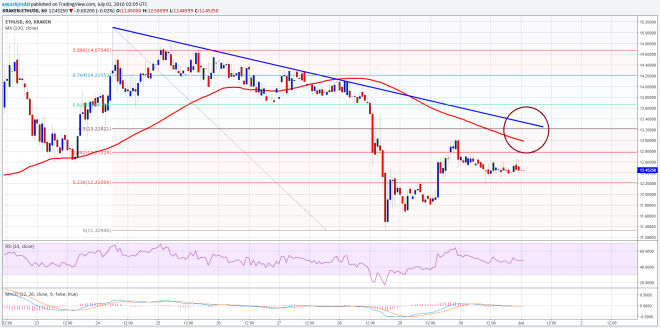

The price recently failed to settle above the 38.2% Fib retracement level of the last drop from the $15.10 high to $11.32 low. I think if the current weakness continues and the price remains below the highlighted resistance area, there is a chance of further losses in ETH/USD.
Hourly MACD – The MACD is almost flat, and there are no major signs of a bullish wave.
Hourly RSI – The RSI is below the 50 level, which is not a good sign for the ETH buyers.
Major Support Level – $12.00
Major Resistance Level – $13.00
Charts courtesy of Kraken via Trading View