Key Highlights
- Ethereum price showed a lot of positive signs recently against the US Dollar and moved higher.
- There is currently a resistance trend line formed on the hourly chart (data feed via SimpleFX) of ETH/USD, which is preventing further gains.
- The pair is above the 100 hourly simple moving average, suggesting good signs in the near term.
Ethereum price looks like trading in a bullish area against the US Dollar, but the bulls must trade carefully as there may be swing moves.
Ethereum Price Support
Ethereum price ETH traded higher during the past 24 hours against the US Dollar and posted a new intraday high of $11.34. There was a solid buying interest noted for the ETH, which helped it to gain traction against the USD. The price after trading above the $11.00 level started consolidating, and may correct a few points lower before it can move back higher.
At this moment, there is a resistance trend line formed on the hourly chart (data feed via Kraken) of ETH/USD, acting as a barrier for further gains above the $11.20-30 levels. So, there is a chance of a minor dip in the near term. An immediate support on the downside can be around the 23.6% Fib retracement level of the last wave from the $$8.85 low to $11.34 high.
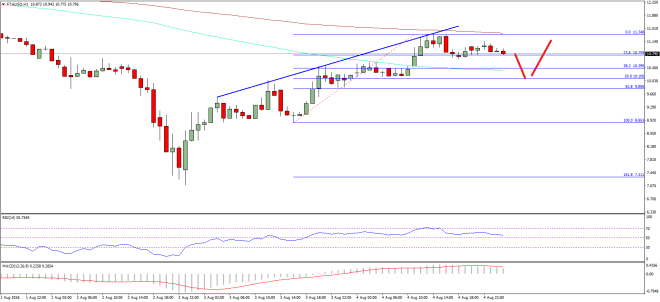

However, the most important support on the downside can be around the 100 hourly simple moving average, as it is also aligned with the 38.2% Fib retracement level of the last wave from the $$8.85 low to $11.34 high. One may consider entering a buy trade, but with a tight stop. A break below the $10.00 support area may trigger further losses in ETH/USD.
Hourly MACD – The MACD is in the bullish zone, but may move soon in the bearish zone.
Hourly RSI – The RSI is also above the 50 level, which is a positive sign.
Major Support Level – $10.40
Major Resistance Level – $11.35
Charts courtesy – SimpleFX