

Key Highlights
- Ripple price is currently moving inside a range below the $0.7300 resistance against the US dollar.
- There is a short-term contracting triangle forming with support near $0.6900 on the hourly chart of the XRP/USD pair (data source from SimpleFx).
- The pair looks set to make the next move either above $0.7400 or below $0.6900 in the near term.
Ripple price is poised to make the next move against the US Dollar and Bitcoin. XRP/USD may soon climb higher above the $0.7300 and $0.7400 resistance levels.
Ripple Price Resistance
There was no major upside move above $0.7400 during the past two sessions in Ripple price against the US Dollar. The price attempted an upside break above $0.7400-0.7500 recently, but it failed to gain momentum. The recent high was $0.7640 from where the price mostly traded inside a range. It moved below the 23.6% Fib retracement level of the last wave from the $0.5180 low to $0.7640 high.
However, the downside move was protected by the $0.6600 support area. Moreover, the 38.2% Fib retracement level of the last wave from the $0.5180 low to $0.7640 high also acted as a support. At the moment, it seems like the price is preparing for the next move either above $0.7400 or below $0.6900 in the near term. There is a short-term contracting triangle forming with support near $0.6900 on the hourly chart of the XRP/USD pair. A break above the $0.7400 level could push the price above $0.7600 or even $0.8000.
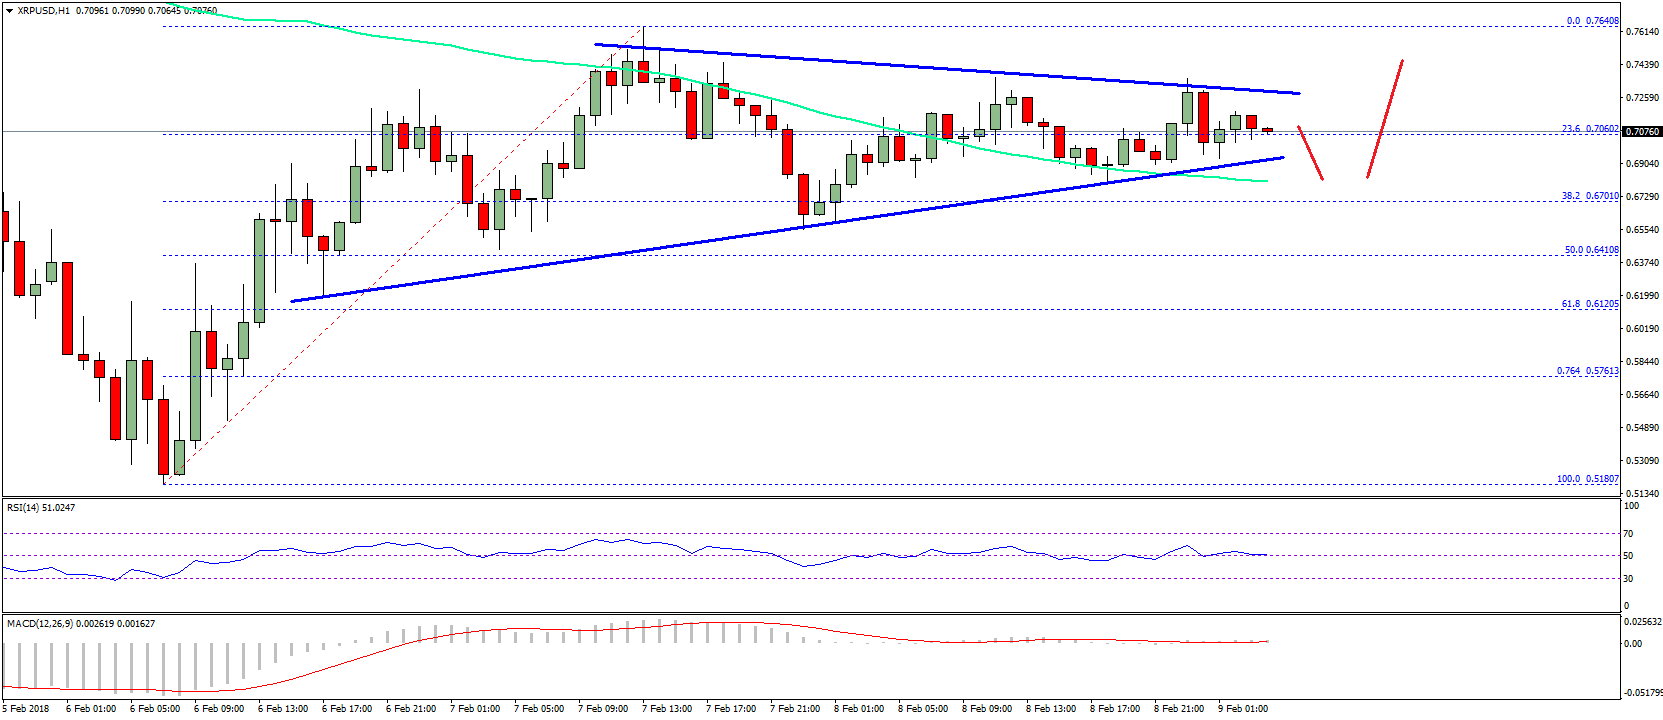

On the downside, the $0.7000 and $0.6900 levels are decent supports. The pair has to stay above the $0.6900 level to make an upside move, otherwise, it could retest the $0.6500 support.
Looking at the technical indicators:
Hourly MACD – The MACD for XRP/USD is mostly flat with a few bearish signs.
Hourly RSI (Relative Strength Index) – The RSI for XRP/USD is just above the 50 level.
Major Support Level – $0.6900
Major Resistance Level – $0.7400
Charts courtesy – SimpleFX