
Key Highlights
- Ripple price is struggling to break the $0.2400 resistance is approaching a short-term break against the US Dollar.
- There is a contracting triangle forming with support at $0.2300 on the hourly chart of the XRP/USD pair (data source from Kraken).
- The pair might make an upside move above $0.2400 as long as it is above the 100 hourly simple moving average.
Ripple price remains well supported against the US Dollar and Bitcoin. XRP/USD might soon clear the $0.2400 resistance for more gains.
Ripple Price Trend
There was no major move in Ripple price either above $0.2400 or below $0.2200 during the weekend against the US Dollar. However, the price remained well supported above the $0.2200 level. It recently traded close to the $0.2500 level from where a correction was initiated. It moved below the 38.2% Fib retracement level of the last wave from the $0.2050 low to $0.2489 high.
The downside move was protected by the $0.2200 support. Moreover, the 50% Fib retracement level of the last wave from the $0.2050 low to $0.2489 high also prevented declines. At the moment, the price is now above the $0.2300 support and the 100 hourly simple moving average. These are positive signs and it seems like there is a contracting triangle forming with support at $0.2300 on the hourly chart of the XRP/USD pair. The pair is slowly approaching towards the next break either above $0.2400 or below $0.2300.
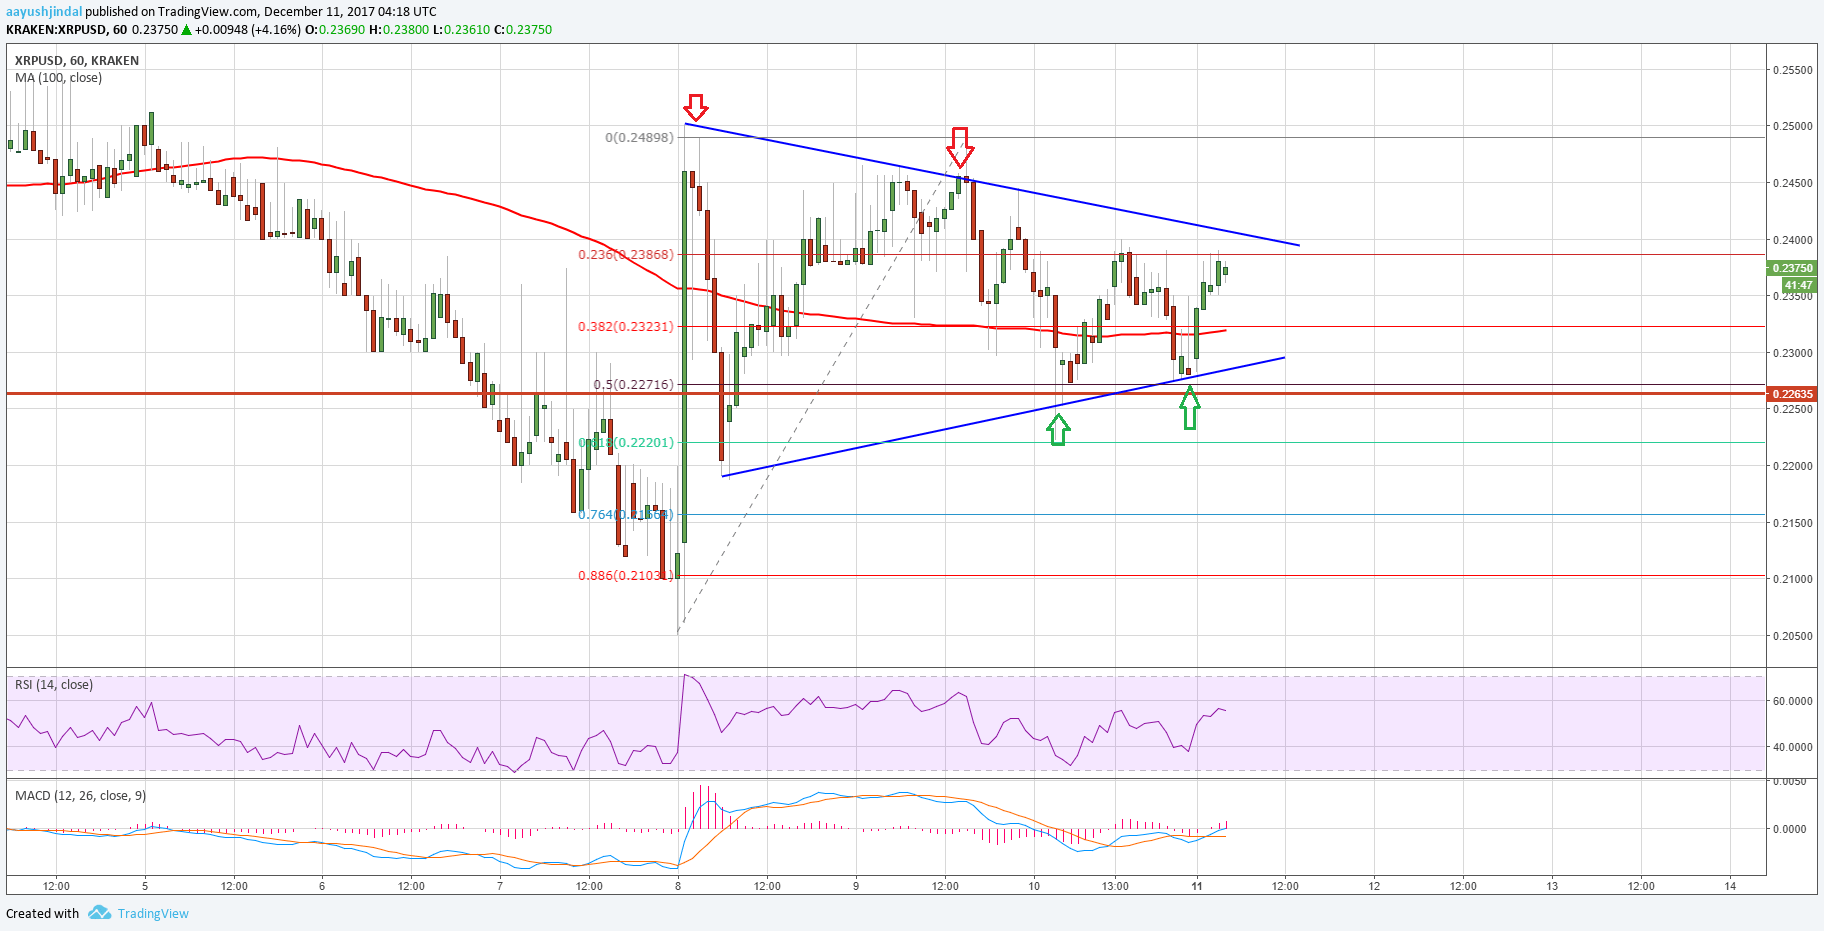
As long as the pair is above $0.2300 and the 100 hourly SMA, there are chances of an upside break. On the flip side, a downside break below $0.2300 would call for a test of the $0.2050 low.
Looking at the technical indicators:
Hourly MACD – The MACD for XRP/USD is now moving nicely in the bullish zone.
Hourly RSI (Relative Strength Index) – The RSI for XRP/USD is currently well above the 50 level and is moving higher.
Major Support Level – $0.2300
Major Resistance Level – $0.2400
Charts courtesy – Trading View, Kraken