
Key Highlights
- Ripple price made a nice upside move and broke the $0.2500 resistance against the US Dollar.
- Yesterday’s highlighted contracting triangle with resistance at $0.2400 was broken on the hourly chart of the XRP/USD pair (data source from Kraken).
- The pair is now well above the $0.2550 level and looks set for more gains in the near term.
Ripple price broke key resistances against the US Dollar and Bitcoin. XRP/USD is now above $0.2500 and eyeing further upsides.
Ripple Price Upside Break
There was a good upside reaction in Ripple price recently as it moved above the $0.2350 level against the US Dollar. The upside move was strong as the price was able to move above the $0.2400 and $0.2500 resistance levels. Earlier, there was a minor correction towards 50% Fib retracement level of the last leg from the $0.2050 low to $0.2490 high. However, buyers appeared and pushed the price above $0.2400.
During the upside, yesterday’s highlighted contracting triangle with resistance at $0.2400 was broken on the hourly chart of the XRP/USD pair. The pair recently traded as high as $0.2612 and is currently placed well above the 100 hourly simple moving average. It seems like there can be more gains above $0.2600 in the near term. The next major resistance is around the $0.2800 pivot.
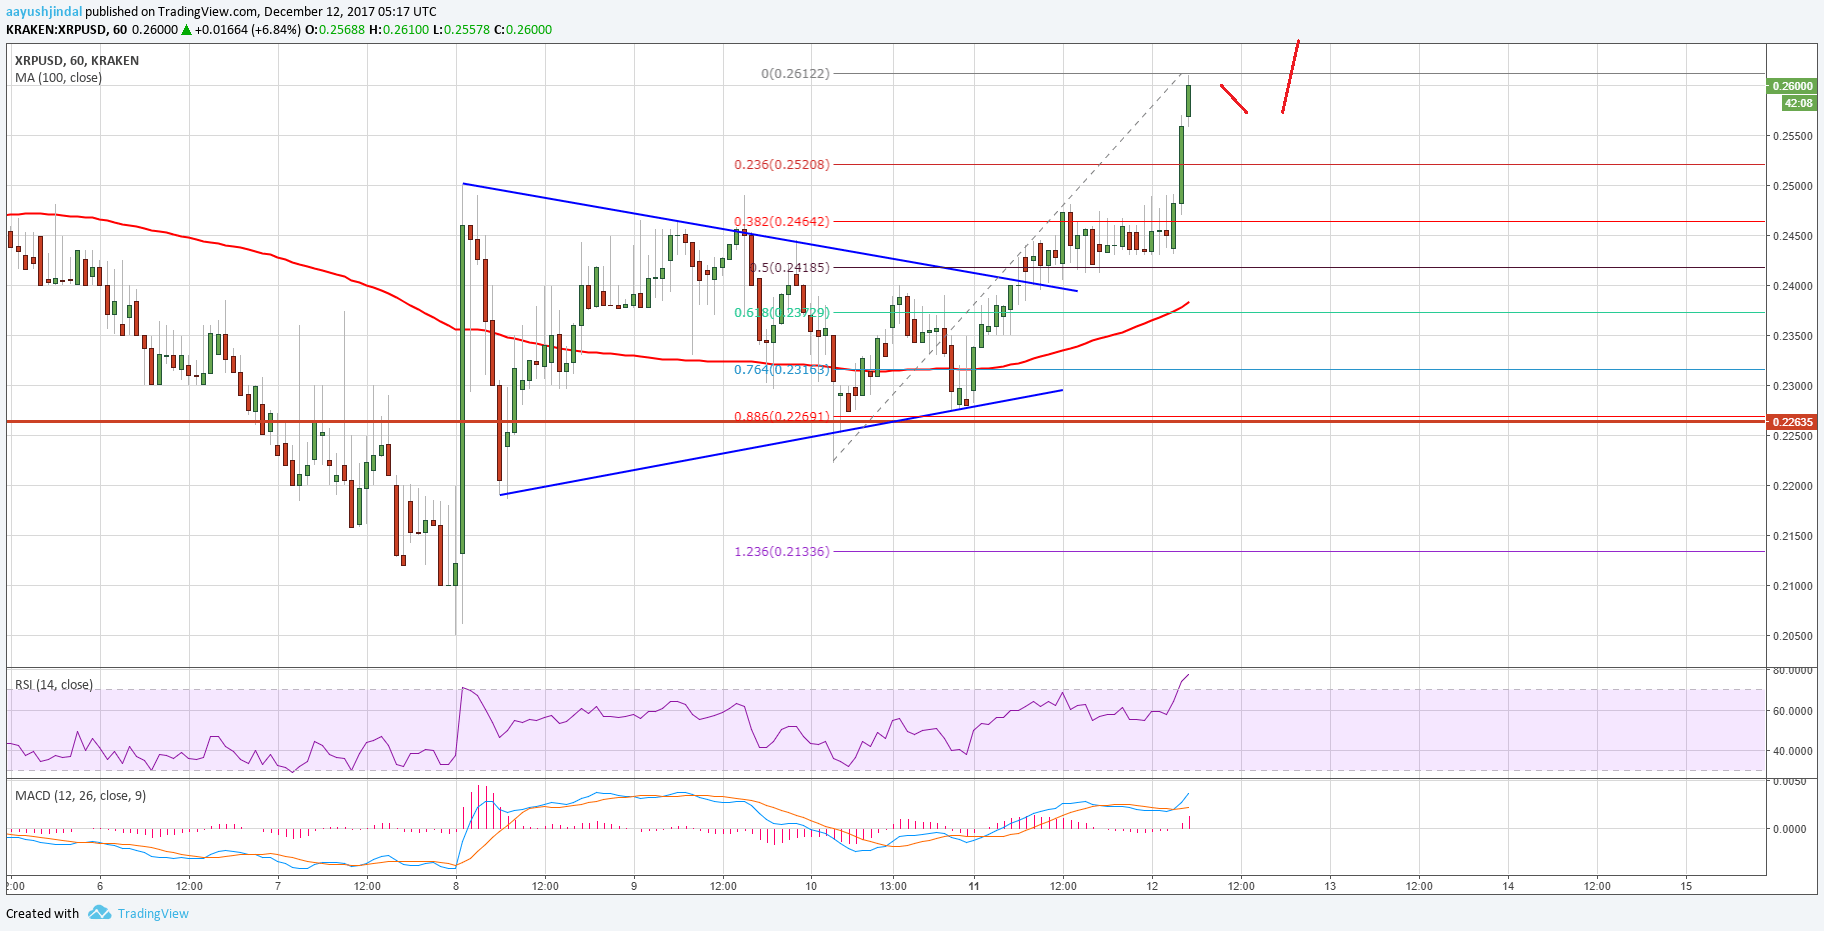
On the downside, an initial support is around the 23.6% Fib retracement level of the last wave from the $0.2230 low to $0.2612 high. However, the most important support is now at $0.2400, which was a resistance earlier. The mentioned $2400 support is also around the 50% Fib retracement level of the last wave from the $0.2230 low to $0.2612 high. Therefore, the price is now well supported above $0.2400 for more gains towards $0.2800.
Looking at the technical indicators:
Hourly MACD – The MACD for XRP/USD is now placed nicely in the bullish zone.
Hourly RSI (Relative Strength Index) – The RSI for XRP/USD has reached the overbought levels.
Major Support Level – $0.2400
Major Resistance Level – $0.2800
Charts courtesy – Trading View, Kraken