
Key Highlights
- Ripple price moved above the $0.7000 resistance and is currently consolidating gains against the US dollar.
- There is a short-term connecting bearish trend line forming with resistance at $0.7065 on the hourly chart of the XRP/USD pair (data source from SimpleFx).
- The pair may soon break the $0.7065 resistance and the 100 hourly simple moving average to gain momentum.
Ripple price is trading nicely with positive signs against the US Dollar and Bitcoin. XRP/USD is likely to move above $0.7500 in the near term once the current consolidation is over.
Ripple Price Trend
There was a decent start of an upside move from $0.5500 in Ripple price yesterday against the US Dollar. The price climbed higher and succeeded in breaking the $0.7000 resistance. The upside move was strong since the price settled above the $0.6500 pivot level. There was also break above the 50% Fib retracement level of the last drop from the $0.9675 high to $0.5178 low.
More importantly, there was a break above a crucial bearish trend line at $0.6800 on the hourly chart of the XRP/USD pair. The pair traded as high as $0.7649 and is currently correcting lower. It is currently below the 0.7000 level and the 100 hourly simple moving average. During the slide, the pair tested the 23.6% Fib retracement level of the last wave from the $0.5180 low to $0.7649 high. However, the broken trend line acted as a support near the $0.6500 level.
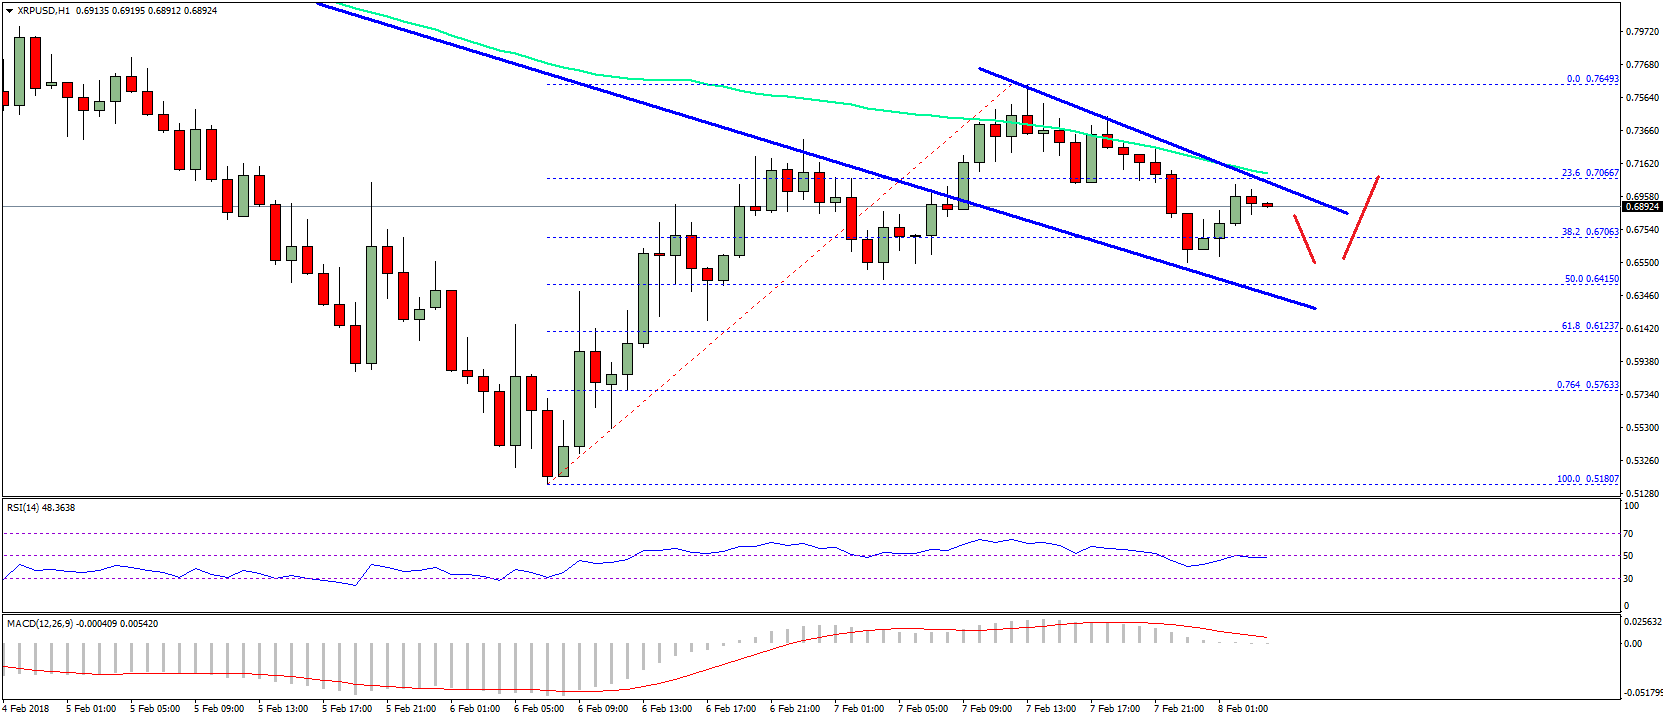

On the upside, there is a short-term connecting bearish trend line forming with resistance at $0.7065 on the same chart. XRP buyers need to break the trend line resistance at $0.7065 and the 100 hourly simple moving average to gain momentum.
Looking at the technical indicators:
Hourly MACD – The MACD for XRP/USD is struggling to gain momentum in the bullish zone.
Hourly RSI (Relative Strength Index) – The RSI for XRP/USD is just around the 50 level.
Major Support Level – $0.6500
Major Resistance Level – $0.7065
Charts courtesy – SimpleFX