

Key Highlights
- Ripple price remains in major uptrend above the $0.2350 support against the US Dollar.
- Yesterday’s highlighted ascending channel with current support near $0.2350 is intact on the hourly chart of the XRP/USD pair (data source from Kraken).
- The pair will most likely move further higher towards the 0.2550 and 0.2600 levels.
Ripple price is placed well in the bullish zone against the US Dollar and Bitcoin. XRP/USD might soon retest $0.2600 and it could even break it.
Ripple Price Trend
There were slow and steady gains in Ripple price above $0.2300 against the US Dollar. The price after declining towards $0.2000 found support and since then moved higher. It moved above the 50% Fib retracement level of the last decline from the $0.2680 high to 0.2048 low. The best part is the fact that the price is now placed well above the $0.2300 support and the 100 hourly simple moving average.
More importantly, yesterday’s highlighted ascending channel with current support near $0.2350 is intact on the hourly chart of the XRP/USD pair. The pair is likely to continue moving higher and it might soon test the channel resistance near $0.2550. The stated $0.2550 level also represents the 76.4% Fib retracement level of the last decline from the $0.2680 high to 0.2048 low. Above $0.2550, the pair would easily break the $0.2600 level for more gains in the near term. There are even chances of XRP retesting the last swing high of $0.2650.
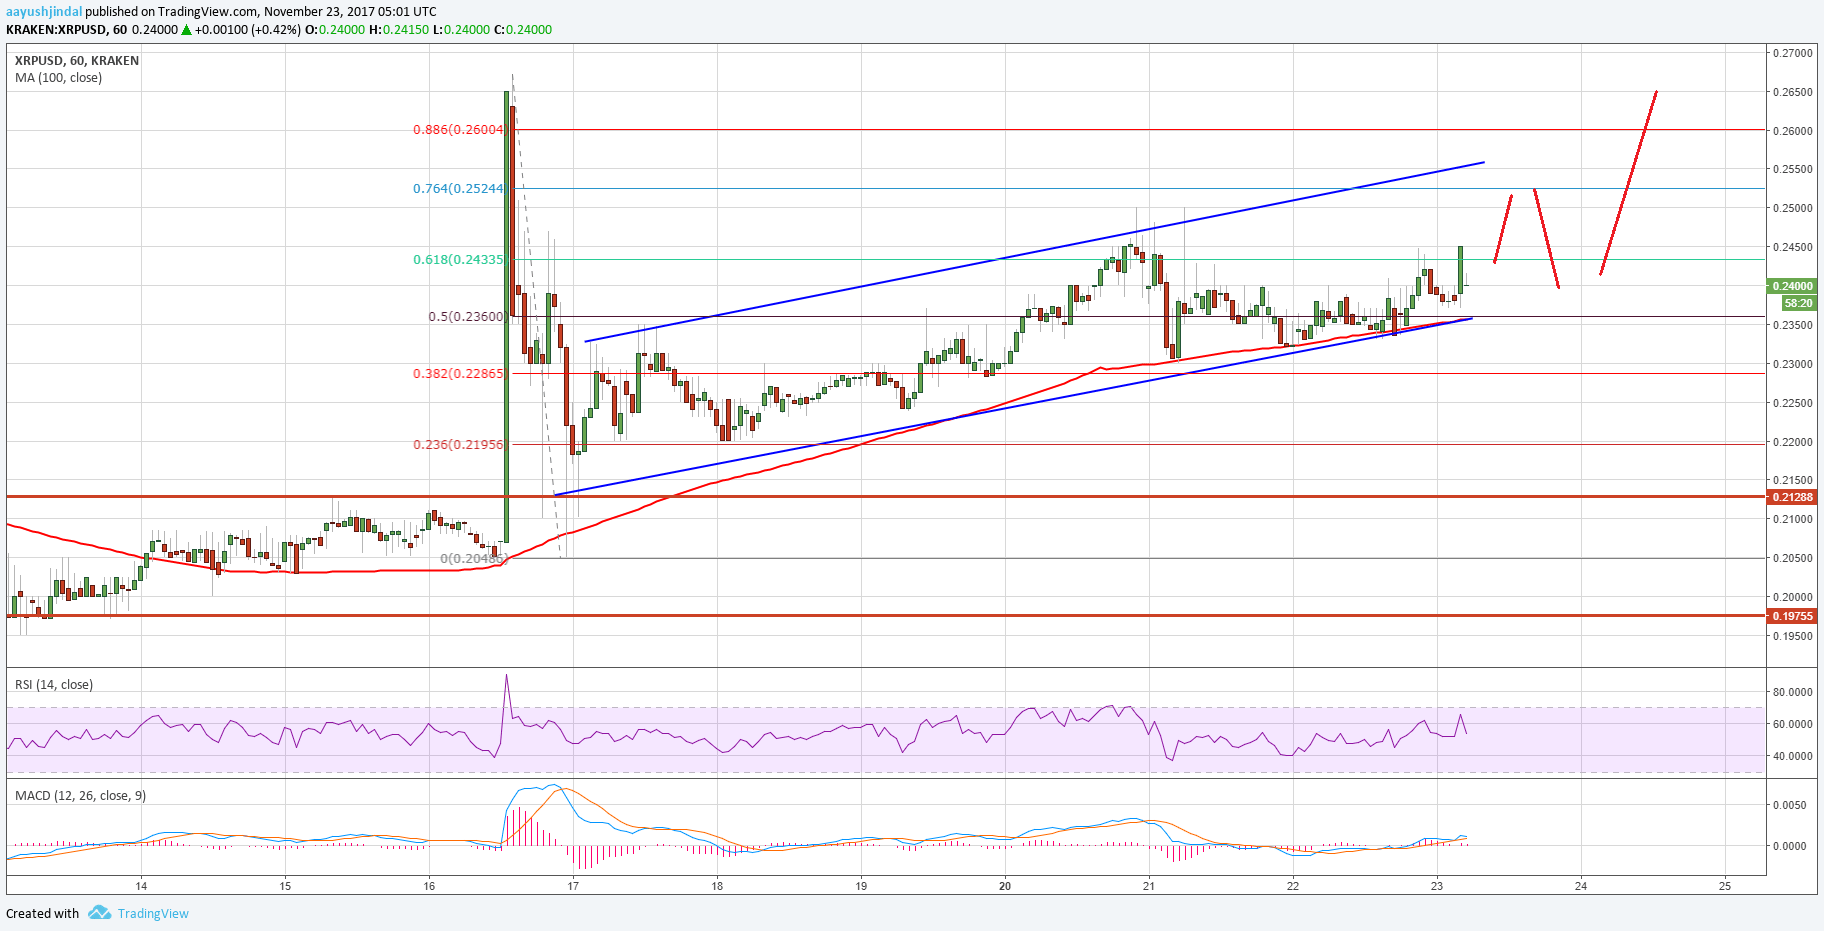
On the downside, the channel support at $0.2350 is very important. The stated $0.2350 support also coincides with the 100 hourly simple moving average. Therefore, $0.2350 and $0.2300 can be considered as a good buy zone as long as the pair is above the 100 hourly SMA.
Looking at the technical indicators:
Hourly MACD – The MACD for XRP/USD is moving nicely in the bearish zone.
Hourly RSI (Relative Strength Index) – The RSI for XRP/USD is above the 50 level and is showing positive signs.
Major Support Level – $0.2350
Major Resistance Level – $0.2550
Charts courtesy – Trading View, Kraken