Key Highlights
- Ripple price is moving higher from the $0.2050 support zone against the US Dollar.
- There is an ascending channel forming with support near $0.2320 on the hourly chart of the XRP/USD pair (data source from Kraken).
- The pair is likely to continue gaining pace as long as it stays above $0.2300 and the 100 hourly simple moving average.
Ripple price is slowly gaining bullish momentum against the US Dollar and Bitcoin. XRP/USD is currently well supported on the downside near $0.2300.
Ripple Price Support
After a sharp correction towards $0.2050, Ripple price found support against the US Dollar. The price started an upside move and traded above the $0.2300 and $0.2400 resistance levels. It recently tested the $0.2500 resistance where it struggled and started a downside correction. It has moved below the 23.6% Fib retracement level of the last wave from the $0.2050 low to $0.2500 high.
However, the downside move is finding support near $0.2300 and 100 hourly simple moving average. Moreover, the 38.2% Fib retracement level of the last wave from the $0.2050 low to $0.2500 high also acted as a support. It seems like there is an ascending channel forming with support near $0.2320 on the hourly chart of the XRP/USD pair. As long as the pair is above the $0.2300 support and the 100 hourly SMA, it remains in an uptrend.
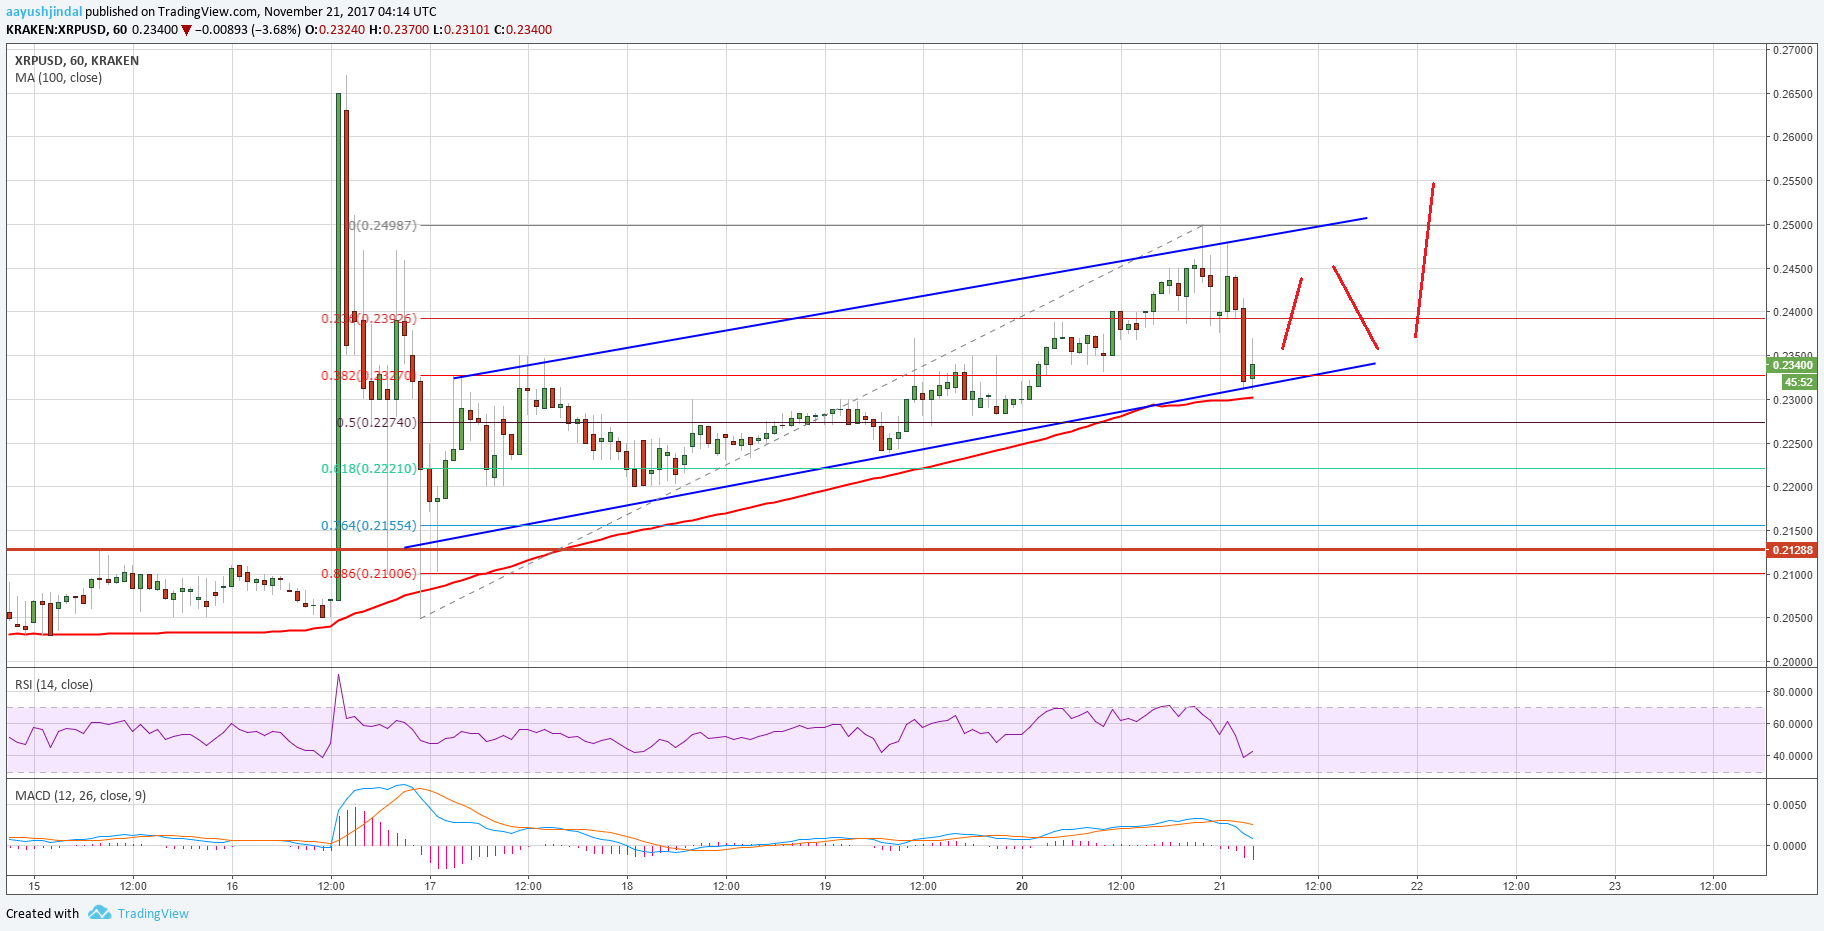
It will most likely resume its upside move towards $0.2500 in the near term. Above $0.2500, the price could move towards the last swing high of $0.2650. On the downside, a break below the $0.2300 support would call for more declines. The next important support in the mentioned case is around $0.2150.
Looking at the technical indicators:
Hourly MACD – The MACD for XRP/USD is currently in the bearish zone.
Hourly RSI (Relative Strength Index) – The RSI for XRP/USD is currently well below the 50 level.
Major Support Level – $0.2300
Major Resistance Level – $0.2500
Charts courtesy – Trading View, Kraken