Key Highlights
- Ripple price started a major upside move from the $0.8850 swing low against the US dollar.
- There was a break above a key bearish trend line with resistance at $0.9300 on the hourly chart of the XRP/USD pair (data source from Kraken).
- The pair traded above the $1.000 level before starting a downside correction.
Ripple price traded above key resistance levels against the US Dollar and Bitcoin. XRP/USD is now trading in a bullish zone above the $0.9400 support.
Ripple Price Trend
After a brief consolidation around the $0.9000 level, Ripple price formed a base against the US Dollar. The price started a nice upside move from the $0.8850 swing low and moved above the $0.9200 resistance level. There was also a break above the $0.9400 resistance and a close above the 100 hourly simple moving average. These are positive signs and the price traded above the $1.000 level before starting a downside correction.
More importantly, there was a break above a key bearish trend line with resistance at $0.9300 on the hourly chart of the XRP/USD pair. Later, the pair corrected below the 23.6% Fib retracement level of the last wave from the $0.8858 low to $1.0318 high. However, the $0.9700 level is acting as a support. Furthermore, the 50% Fib retracement level of the last wave from the $0.8858 low to $1.0318 high is at $0.9588 to act a support. Therefore, it seems like there are many supports on the downside near the $0.9500 and $0.9400 levels.
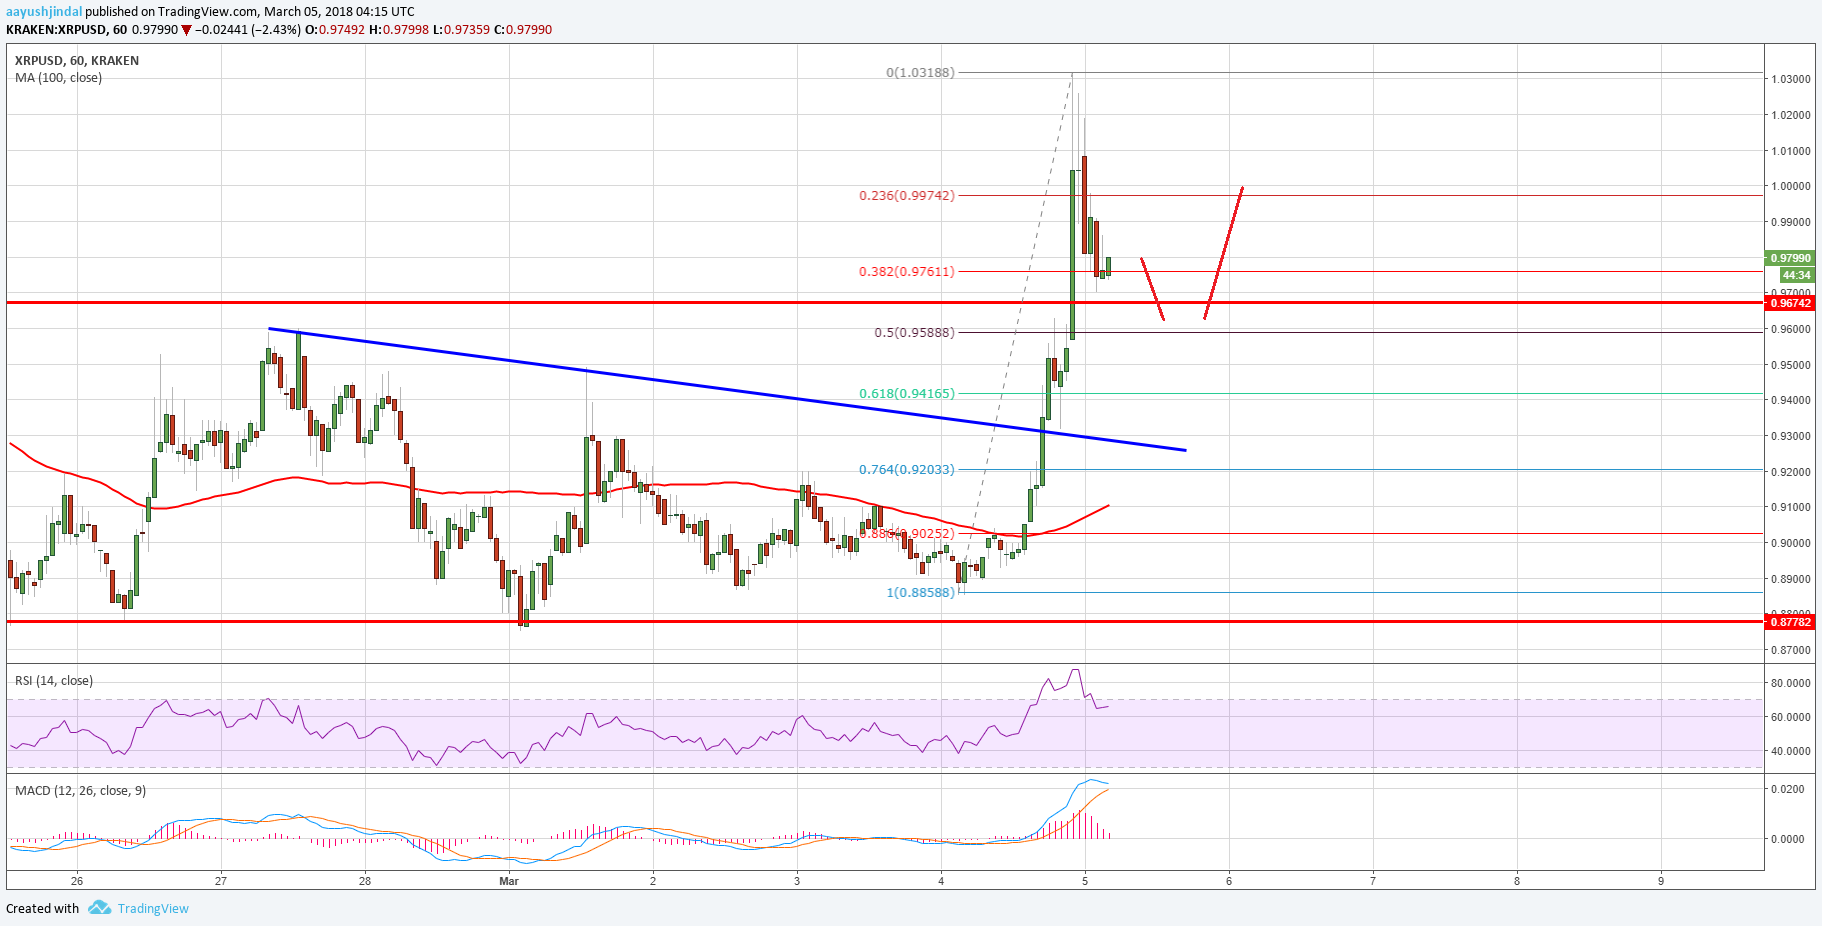

As long as the price is above $0.9400, it may continue to move higher. On the upside, resistances are seen near the $1.00 and $1.02 levels, followed by the recent high of $1.031.
Looking at the technical indicators:
Hourly MACD – The MACD for XRP/USD is slowly reducing its bullish slope.
Hourly RSI (Relative Strength Index) – The RSI for XRP/USD is currently well above the 50 level.
Major Support Level – $0.9400
Major Resistance Level – $1.0200
Charts courtesy – Trading View