

Key Highlights
- Ripple price started a downside correction after trading above the $3.30 level against the US Dollar.
- Yesterday’s highlighted important bullish trend line with support at $2.40 is intact on the hourly chart of the XRP/USD pair (data source from Kraken).
- The pair might continue to hold the $2.40-2.30 support area and it could even bounce back.
Ripple price is currently correcting lower against the US Dollar and Bitcoin. XRP/USD is testing an important support at $2.30 and it could bounce back.
Ripple Price Support
There was an extension to yesterday’s move in Ripple price as it moved above the $3.00 level against the US Dollar. The price even traded above the $3.30 level and posted a new all-time high of $3.3385. Later, a downside correction was initiated and the price moved below the $3.00 support. It also traded below a trend line support at $2.80. Moreover, there was a push below the 50% Fib retracement level of the last wave from the $2.15 low to $3.331 high.
However, the downside wave was protected by the $2.40 support. In addition, yesterday’s highlighted important bullish trend line with support at $2.40 is intact on the hourly chart of the XRP/USD pair. It is acting as a major support and preventing declines below $2.30. More importantly, the 100 hourly simple moving average is also around $2.40 and is acting as a major hurdle for more losses.
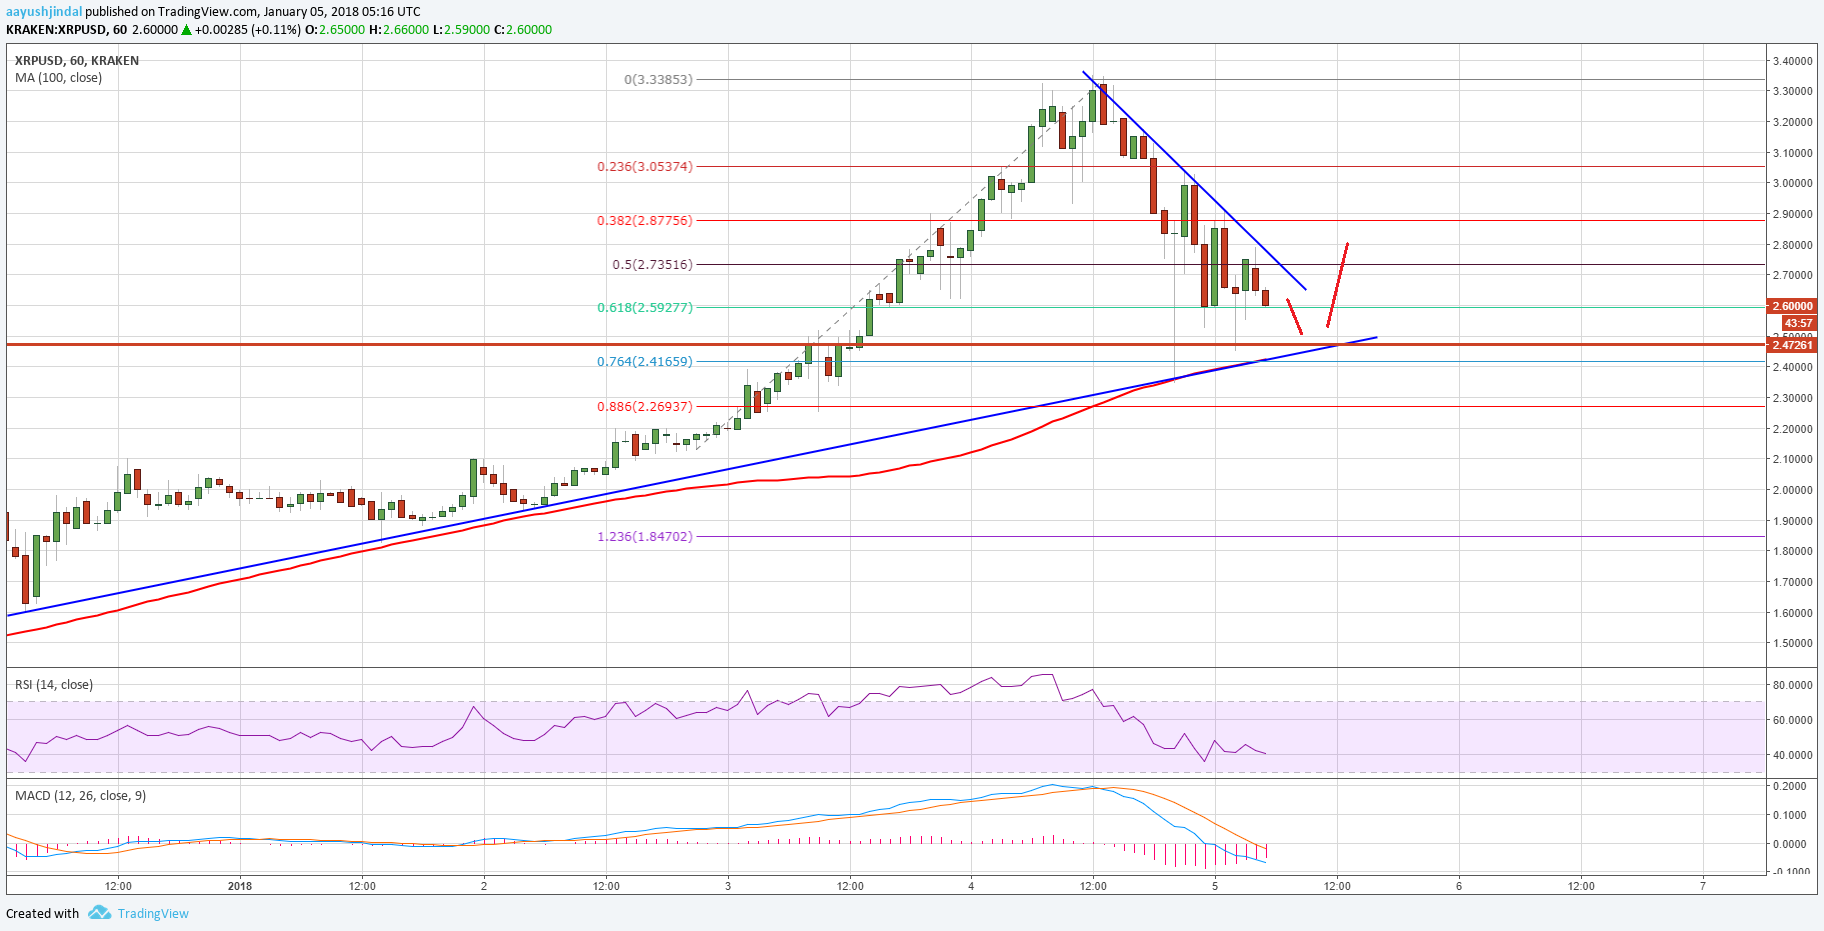

At the moment, the price is trading around the 61.8% Fib retracement level of the last wave from the $2.15 low to $3.331 high. It has to hold the $2.30-2.40 support. On the upside, a break above a connecting bearish trend line at $2.70 is needed for a bounce back.
Looking at the technical indicators:
Hourly MACD – The MACD for XRP/USD is reducing its recent bearish slope.
Hourly RSI (Relative Strength Index) – The RSI for XRP/USD is near 40 and is moving down.
Major Support Level – $2.30
Major Resistance Level – $2.70
Charts courtesy – Trading View, Kraken