Key Highlights
- Ripple price traded above the $1.08 level yesterday before starting a new downside against the US dollar.
- There is a short-term connecting bullish trend line forming with support at $0.9350 on the hourly chart of the XRP/USD pair (data source from Kraken).
- The pair must stay above the $0.9300 level to avoid further declines in the near term.
Ripple price started a fresh downside wave against the US Dollar and Bitcoin. XRP/USD has to move above $0.9800 to move back in the bullish zone.
Ripple Price Support
There was an extension of yesterday’s move above $1.03 in Ripple price against the US Dollar. The price traded above the $1.05 and $1.08 resistance levels. It traded close to the $1.10 level and formed a high at $1.096 before sellers appeared. Later, a downside move was initiated and the price declined sharply below $1.05. There was a break below the 50% Fib retracement level of the last upside wave from the $0.8846 low to $1.0962 high.
Moreover, there was a break below the $0.9800 support level. However, the downside move was protected by the $0.9300 support and the 100 hourly simple moving average. The 76.4% Fib retracement level of the last upside wave from the $0.8846 low to $1.0962 high also acted as a support. Furthermore, there is a short-term connecting bullish trend line forming with support at $0.9350 on the hourly chart of the XRP/USD pair. The trend line support, $0.9300 and the 100 hourly SMA are acting as crucial supports and preventing declines.
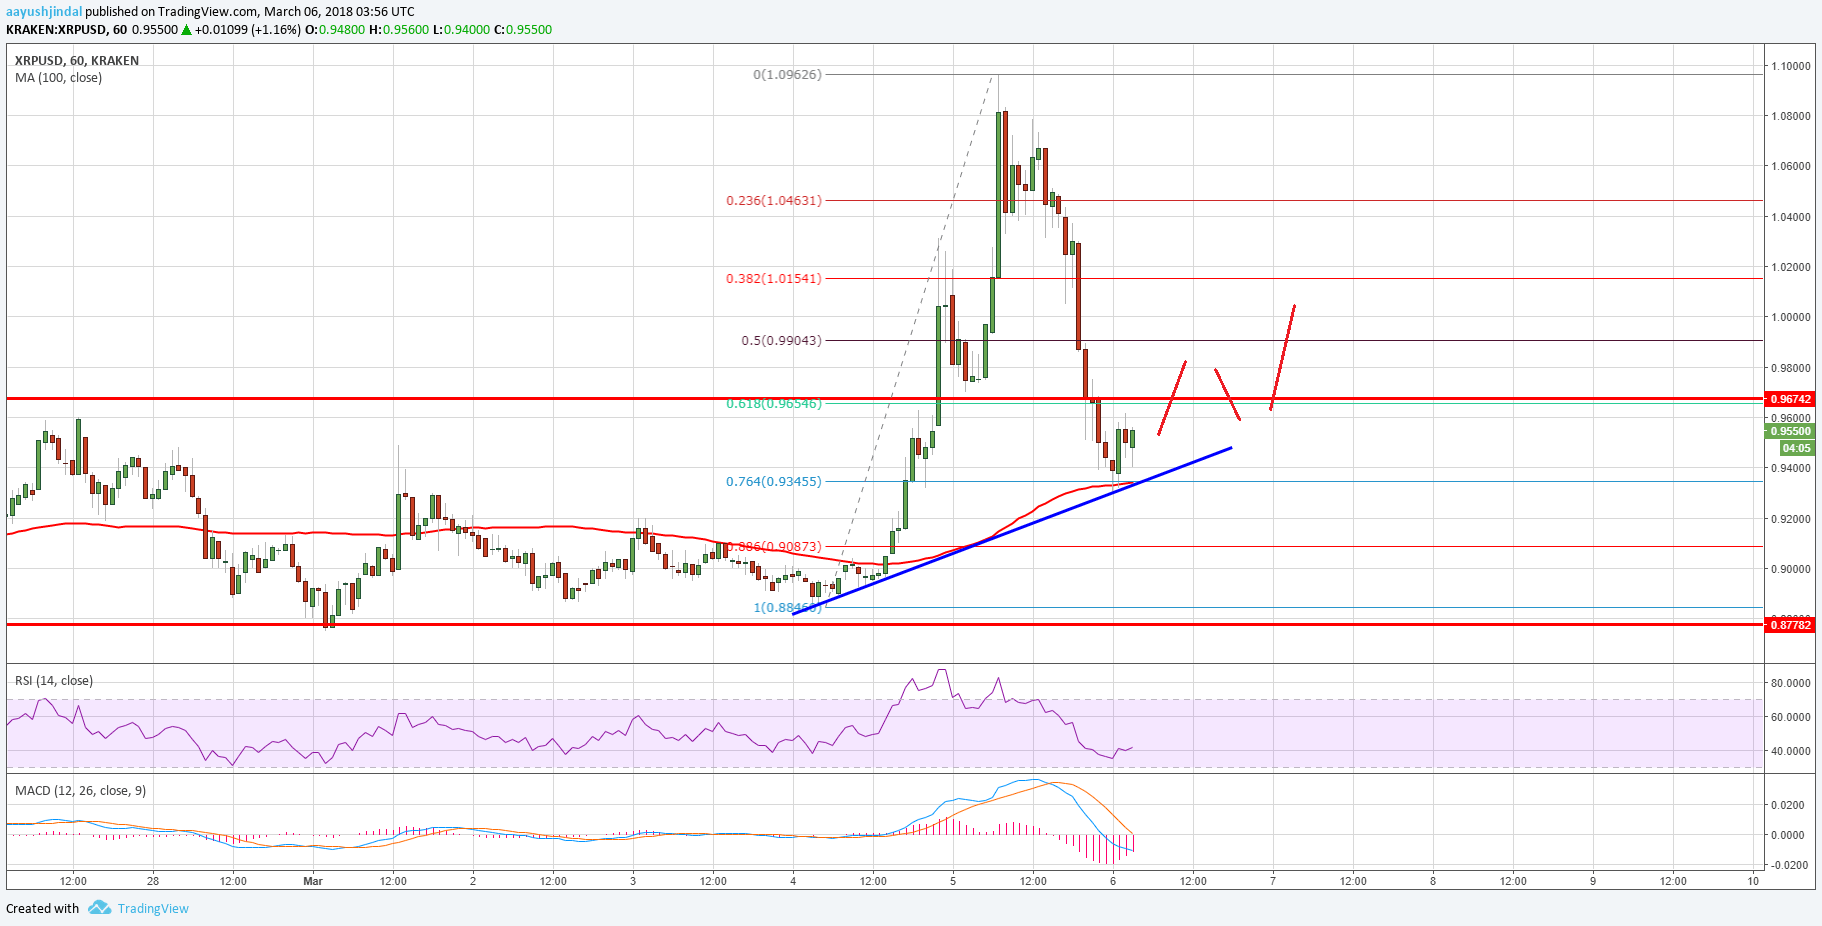

As long as the price is above $0.9300, it may bounce back. On the upside, a break above the $0.9800 level is needed for the price to move back towards $1.0300.
Looking at the technical indicators:
Hourly MACD – The MACD for XRP/USD is reducing the last bearish slope.
Hourly RSI (Relative Strength Index) – The RSI for XRP/USD is correcting higher from the 30 level.
Major Support Level – $0.9300
Major Resistance Level – $0.9800
Charts courtesy – Trading View