
Key Highlights
- Ripple price is gaining pace and it recently moved above the $0.2050 resistance against the US Dollar.
- Yesterday’s highlighted new bearish trend line with resistance at $0.2038 was broken on the hourly chart of the XRP/USD pair (data source from Kraken).
- The price might continue to trade higher towards $0.2100 and $0.2150 in the near term.
Ripple price is slowly moving higher against the US Dollar and Bitcoin. XRP/USD broke $0.2050 and is currently looking to extend gains.
Ripple Price Support
We recently saw the start of range trading below the $0.2050 resistance in Ripple price against the US Dollar. The price remained above the $0.1960 support and later succeeded in gaining pace. It traded higher and broke the $0.2000 and $0.2025 resistance levels. The best part was a close above the 23.6% Fib retracement level of the last drop from the $0.2175 high to $0.1970 low.
Buyers also succeeded in clearing strong offers near $0.2050 and the 100 hourly simple moving average. Moreover, yesterday’s highlighted new bearish trend line with resistance at $0.2038 was broken on the hourly chart of the XRP/USD pair. The pair is currently moving higher and will most likely test the 50% Fib retracement level of the last drop from the $0.2175 high to $0.1970 low. Buyers are currently gaining momentum and if they remain in control, the price could even test the $0.2150 level.
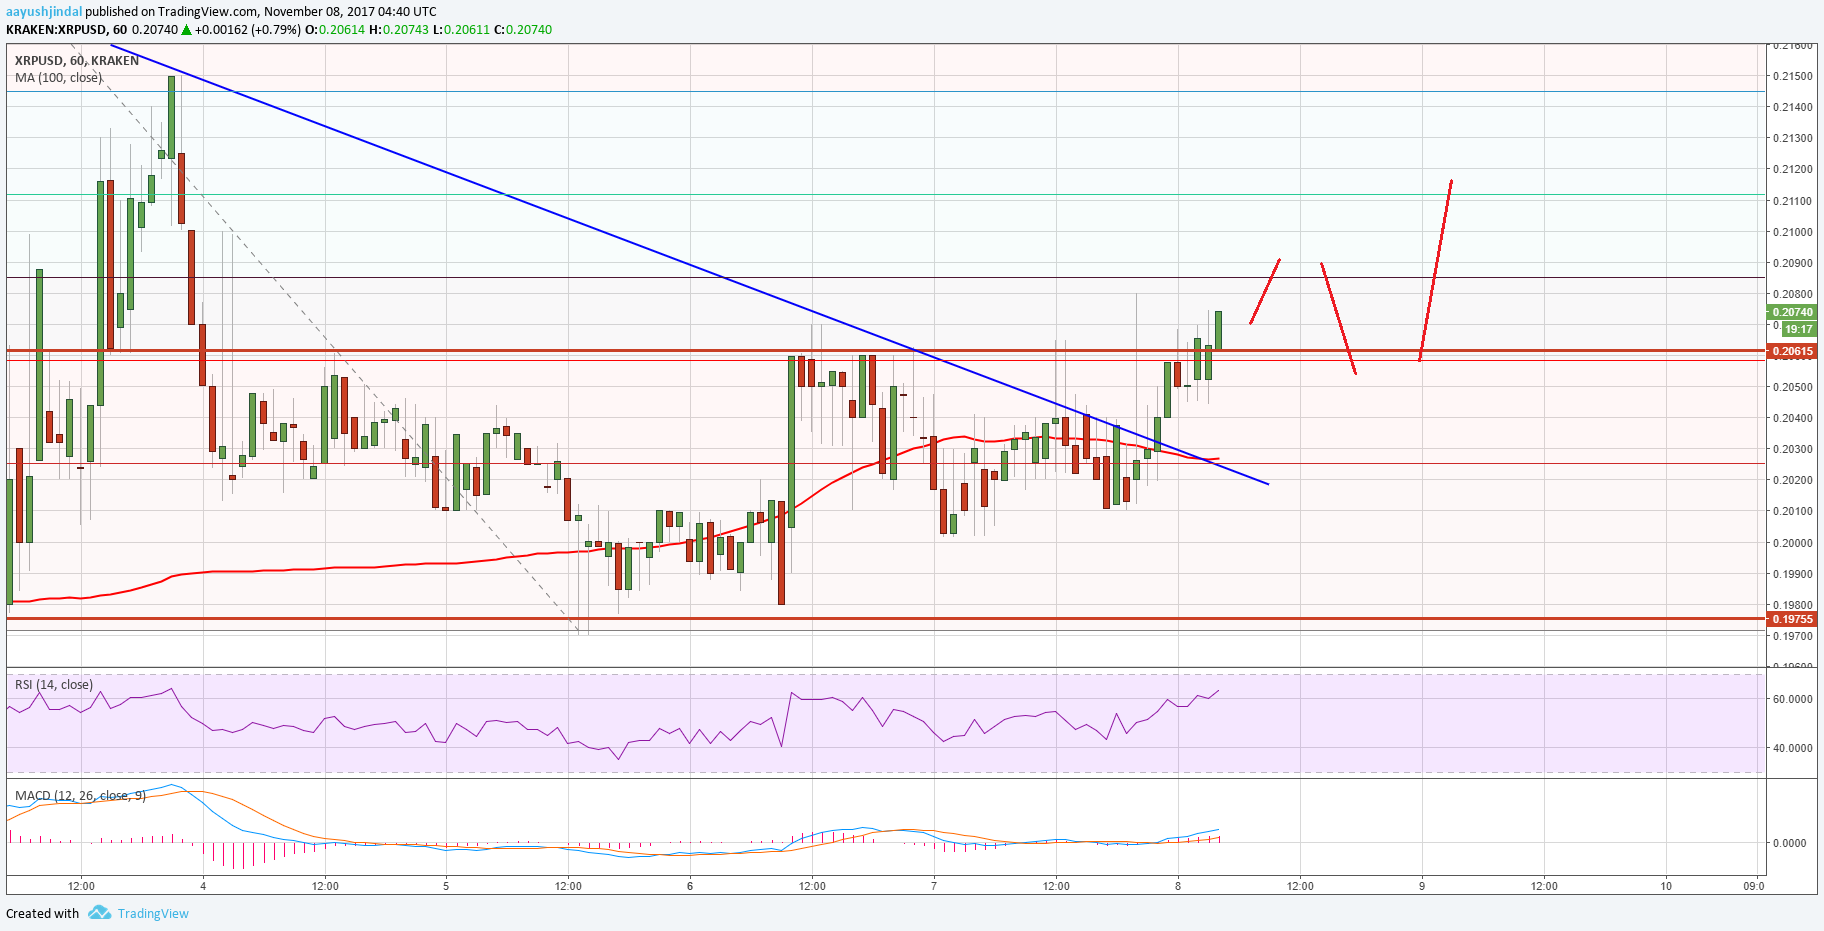
An intermediate resistance is near $0.2100. On the downside, the 100 hourly SMA at $0.2030 is a decent support and a buy zone. Should, there be a break below $0.2030, the price might retest $0.2000. Overall, XRP is back in the positive zone and eyeing $0.2100 and $0.2150 in the near term.
Looking at the technical indicators:
Hourly MACD – The MACD for XRP/USD is back in the bullish zone.
Hourly RSI (Relative Strength Index) – The RSI for XRP/USD is currently above the 60 level.
Major Support Level – $0.2030
Major Resistance Level – $0.2150
Charts courtesy – Trading View, Kraken