
Key Highlights
- Ripple price is slowly moving higher and is currently well above the 0.2040 support against the US Dollar.
- Yesterday’s highlighted contracting triangle with current support at $0.2060 is still in place on the hourly chart of the XRP/USD pair (data source from Kraken).
- The price might soon break the resistance at $0.2120 for more gains in the near term.
Ripple price is slowly gaining bullish pace against the US Dollar and Bitcoin. XRP/USD has to surpass the $0.2120 level for more upsides.
Ripple Price Resistance
There was a slow and steady upside move initiated from the $0.1900 low in Ripple price against the US Dollar. The price was successful in moving above the $0.2000 handle and the 50% Fib retracement level of the last decline from the 0.2215 high to $0.1900 low. The upside move was positive as the price was able to move above the $0.2040 resistance and the 100 hourly simple moving average.
Moreover, yesterday’s highlighted contracting triangle with current support at $0.2060 is still in place on the hourly chart of the XRP/USD pair. As long as the pair is above $0.2060 and $0.2040, there is a chance of it gaining bids for the next leg. On the upside, the pair needs to settle above the 61.8% Fib retracement level of the last decline from the 0.2215 high to $0.1900 low.
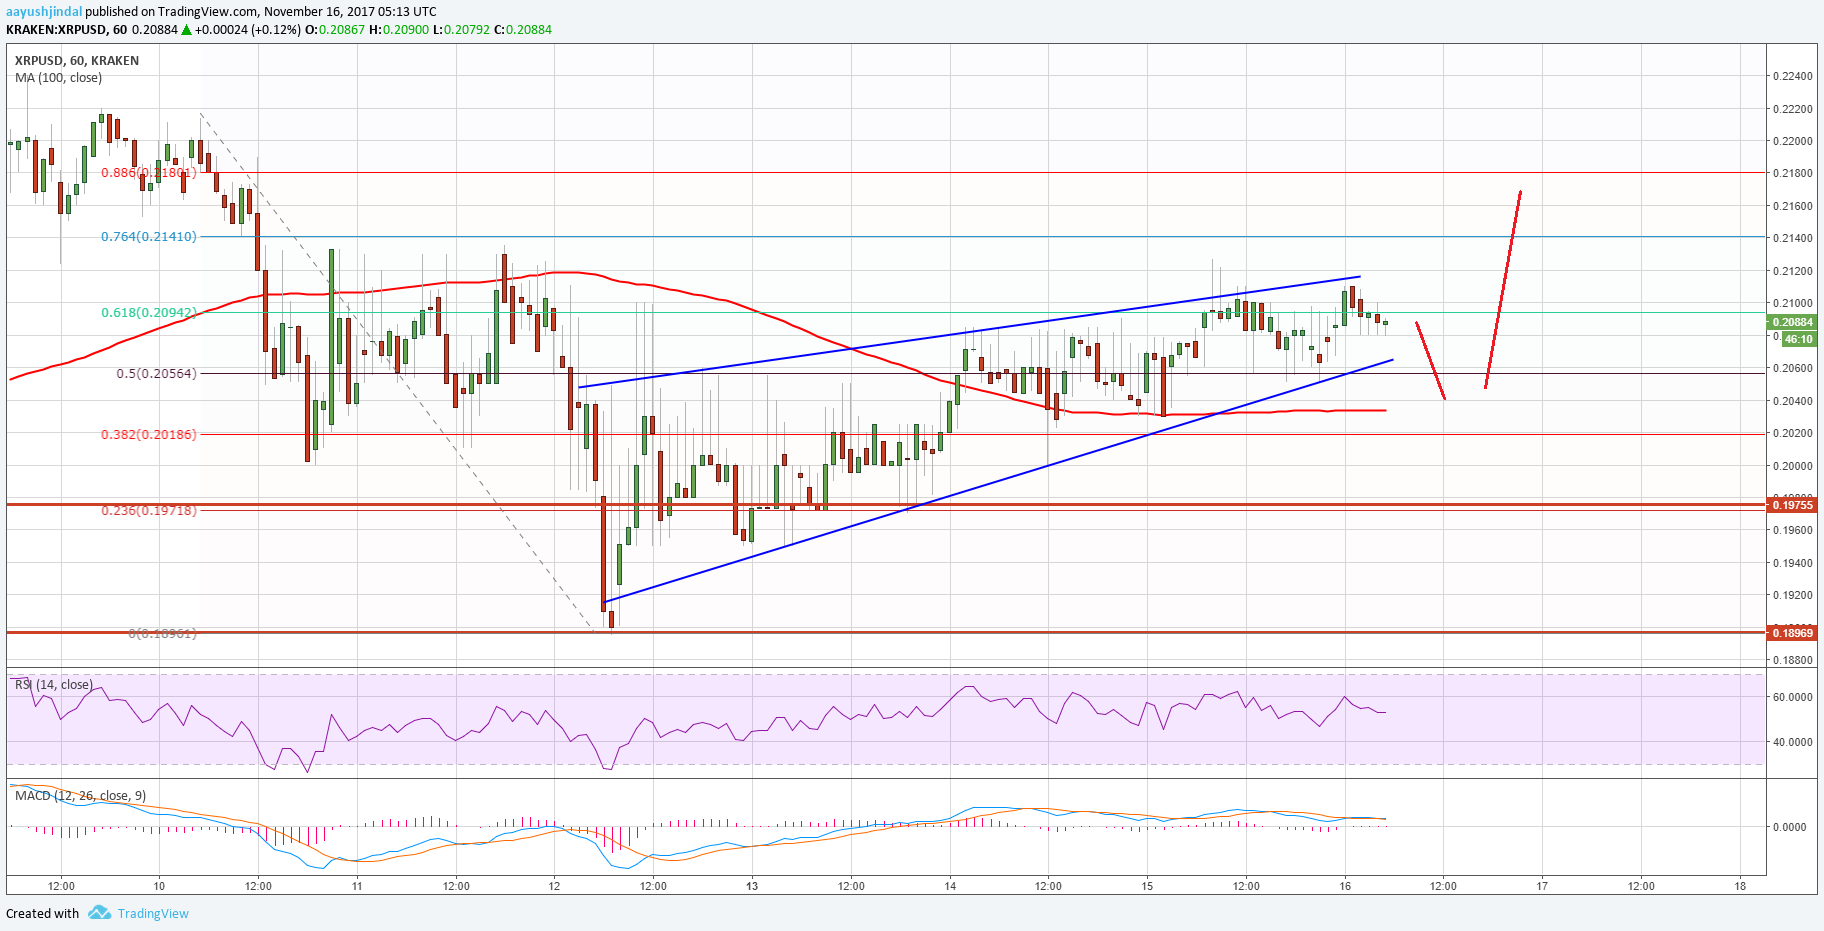
Once the pair is above $0.2120, it could easily move towards the last swing high of $0.2220. On the downside, the mentioned $0.2040 level is a major support near the 100 hourly SMA. Should there be a break below $0.2040, there can be a downside reaction toward the $0.2000 handle.
Looking at the technical indicators:
Hourly MACD – The MACD for XRP/USD is currently attempting to move back in the bullish zone.
Hourly RSI (Relative Strength Index) – The RSI for XRP/USD is moving down from the 60 level toward 50.
Major Support Level – $0.2040
Major Resistance Level – $0.2120
Charts courtesy – Trading View, Kraken