Key Highlights
- Ripple price bounced sharply after testing the $0.1800 handle against the US Dollar.
- There was a break above a bearish trend line at $0.1940 on the hourly chart of the XRP/USD pair (data source from Kraken).
- The price traded towards $0.2200 before running into strong sell offers.
Ripple price recovered well intraday against the US Dollar and Bitcoin. XRP/USD is back above $0.1950, but struggling to hold gains.
Ripple Price Support
Yesterday, we saw the start of a new downside move with a break of the $0.1950 support in Ripple price against the US Dollar. The price extended declines and traded towards the $0.1800 level. A low was formed at $0.1800 before the price started an upside move and bounced sharply. During the bounce, there was a break above a bearish trend line at $0.1940 on the hourly chart of the XRP/USD pair.
More importantly, the pair was able to move above the $0.1950 level and the 100 hourly simple moving average. The upside move was strong as there was a break above the $0.2100 resistance. A high was formed at $0.2199 from where the price started a sharp downside correction. It has already breached the 50% Fib retracement level of the last wave from the $0.1800 low to $0.2199 high. However, it is approaching a major support area near $0.1950 and the 100 hourly SMA.
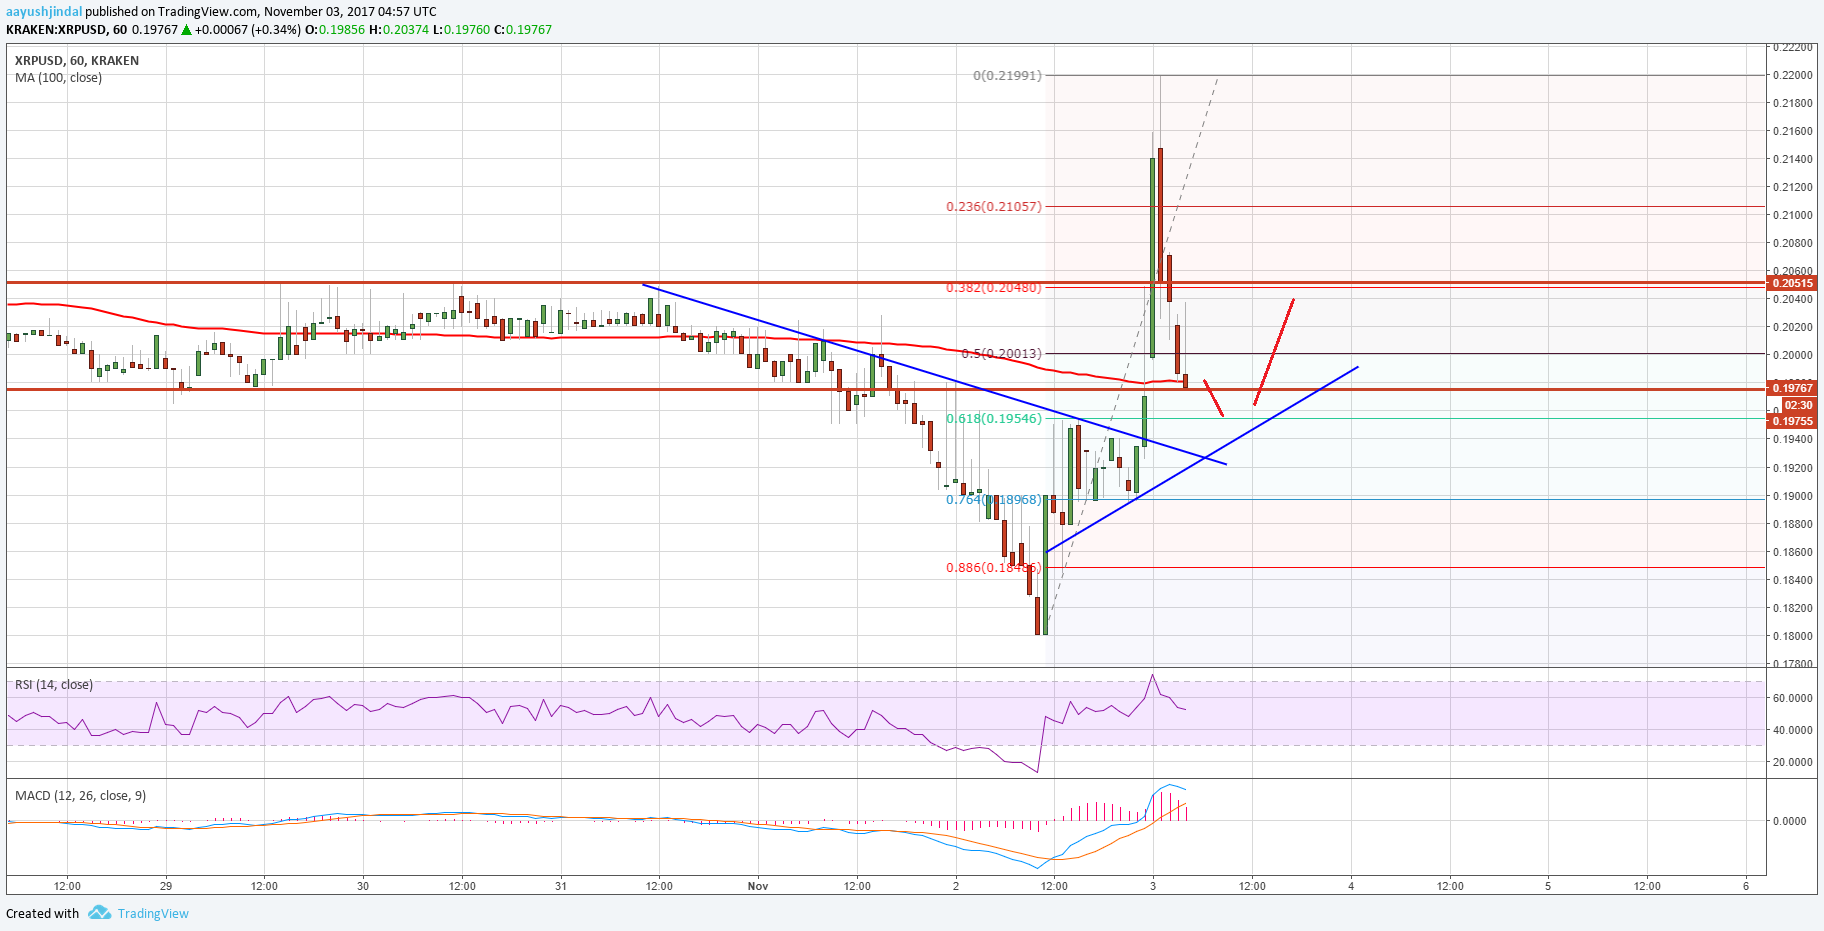
There is also a bullish trend line at $0.1960 and the 61.8% Fib retracement level of the last wave from the $0.1800 low to $0.2199 high at $0.1954. Therefore, once again the $0.1950-0.1960 levels would act as a strong support. The price must stay above $0.1950 to bounce back or it might again test the $0.1850-00 levels.
Looking at the technical indicators:
Hourly MACD – The MACD for XRP/USD is back in the bullish zone.
Hourly RSI (Relative Strength Index) – The RSI for XRP/USD is placed well above the 50 level.
Major Support Level – $0.1950
Major Resistance Level – $0.2100
Charts courtesy – Trading View, Kraken