

You are translating a WordPress post_content field from English to Spanish. Give me the response in a code block to make it easy to copy and paste.
Your job:
Translate only visible natural-language text nodes into Spanish.
Do not change:
- Any HTML tags
- Any attributes
- Any URLs
- Any shortcode syntax
- Any placeholders
- Any code snippets
- Any numbers unless they are part of translatable running text
- Any entity codes
- Any technical strings
Critical preservation rules:
- The output must remain valid HTML.
- The HTML structure must be identical to the input.
- Every placeholder must survive byte-for-byte unchanged.
- Do not invent, summarize, omit, normalize, or improve anything.
- Do not convert HTML to Markdown.
- Do not add introductory or trailing text.
- Return only the translated
post_content.
Input HTML:
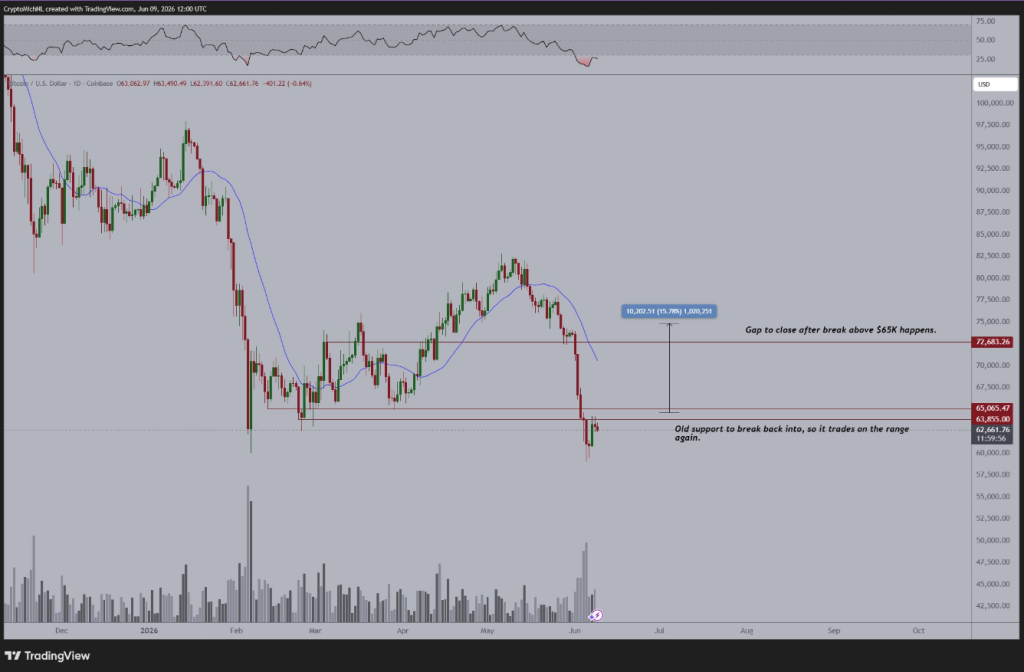
Bitcoin may need to climb back above $65,000 before any meaningful recovery can take hold — but getting there looks harder by the day.
Market analyst Michaël van de Poppe said a break past that level could open the door to a rally toward the $72,000 to $74,000 range, yet the broader demand picture suggests that kind of move is far from guaranteed.
#Bitcoin is stalling beneath $65K as breaking that level would trigger a strong run to $72-74K.
The $65K support level was the previous level of support after the crash early in February and is now acting as the resistance to break through.
If it happens for Bitcoin’s price to… pic.twitter.com/GOaN7KuT0O
— Michaël van de Poppe (@CryptoMichNL) June 9, 2026

Why The Numbers Look Ugly Right Now
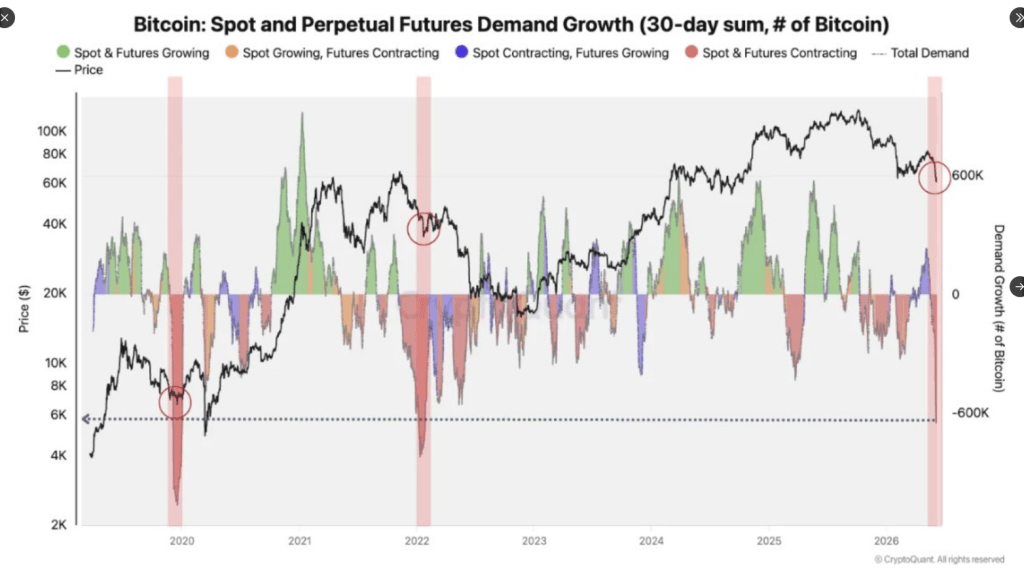
The 30-day combined growth of spot and perpetual futures demand has fallen to around -650,000 BTC, a reading that has appeared only three times since 2019.
CryptoQuant analyst Moreno flagged the figure as a sign that the market has entered one of its weakest demand phases in years, with both regular buying and derivatives exposure falling at the same time. That means fewer buyers are available to absorb any fresh selling pressure.
Bitcoin has dropped roughly 3.40% this week alone, following a 14% decline the week before. The monthly loss now stands at 16%, with prices hovering near $61,000.
Bitcoin Demand Hits a Level Seen Only 3 Times Since 2019
“The current setup therefore looks less like a confirmed reversal and more like the beginning of a final cleansing phase.” – By @MorenoDV_ pic.twitter.com/Qk0lrzTDky
— CryptoQuant.com (@cryptoquant_com) June 9, 2026

What History Actually Shows
The -650,000 BTC demand level has not historically marked a bottom. Based on Moreno’s analysis , it has tended to mark the beginning of a difficult stretch rather than the end of one.
The first instance came in December 2019, when Bitcoin was trading near $6,500 and demand conditions were already deteriorating ahead of the COVID-19 market crash. The demand indicator hit extreme contraction before prices collapsed further in March 2020, eventually bottoming near $3,800.

A second instance appeared in January 2022, when Bitcoin had already fallen from its then-record high of $69,000 to around $32,951. Demand recovered in the following weeks, and prices rebounded into March — but the recovery did not last.
Bitcoin resumed its decline and did not hit its bear-market floor of roughly $15,500 until November 2022, nearly 10 months later.
The Difficult Phase Ahead
Moreno believes the current setup looks more like the start of a final cleansing phase than a confirmed turning point. He expects a period of heightened volatility before the market settles into a prolonged stretch of sideways trading with low participation.
That kind of stagnation, he argues, may prove harder on investors than the price drop itself. Van de Poppe, for his part, called the recent selloff largely irrational, though he acknowledged Bitcoin remains pinned below the $65,000 level that once served as support and has since become resistance.
Featured image from Pexels, chart from TradingView Bitcoin may need to climb back above $65,000 before any meaningful recovery can take hold — but getting there looks harder by the day.
Market analyst Michaël van de Poppe said a break past that level could open the door to a rally toward the $72,000 to $74,000 range, yet the broader demand picture suggests that kind of move is far from guaranteed.
#Bitcoin is stalling beneath $65K as breaking that level would trigger a strong run to $72-74K.
The $65K support level was the previous level of support after the crash early in February and is now acting as the resistance to break through.
If it happens for Bitcoin’s price to… pic.twitter.com/GOaN7KuT0O
— Michaël van de Poppe (@CryptoMichNL) June 9, 2026
Why The Numbers Look Ugly Right Now
The 30-day combined growth of spot and perpetual futures demand has fallen to around -650,000 BTC, a reading that has appeared only three times since 2019.
CryptoQuant analyst Moreno flagged the figure as a sign that the market has entered one of its weakest demand phases in years, with both regular buying and derivatives exposure falling at the same time. That means fewer buyers are available to absorb any fresh selling pressure.
Bitcoin has dropped roughly 3.40% this week alone, following a 14% decline the week before. The monthly loss now stands at 16%, with prices hovering near $61,000.
Bitcoin Demand Hits a Level Seen Only 3 Times Since 2019
“The current setup therefore looks less like a confirmed reversal and more like the beginning of a final cleansing phase.” – By @MorenoDV_ pic.twitter.com/Qk0lrzTDky
— CryptoQuant.com (@cryptoquant_com) June 9, 2026
What History Actually Shows
The -650,000 BTC demand level has not historically marked a bottom. Based on Moreno’s analysis , it has tended to mark the beginning of a difficult stretch rather than the end of one.
The first instance came in December 2019, when Bitcoin was trading near $6,500 and demand conditions were already deteriorating ahead of the COVID-19 market crash. The demand indicator hit extreme contraction before prices collapsed further in March 2020, eventually bottoming near $3,800.
A second instance appeared in January 2022, when Bitcoin had already fallen from its then-record high of $69,000 to around $32,951. Demand recovered in the following weeks, and prices rebounded into March — but the recovery did not last.
Bitcoin resumed its decline and did not hit its bear-market floor of roughly $15,500 until November 2022, nearly 10 months later.