Reason to trust

How Our News is Made
Strict editorial policy that focuses on accuracy, relevance, and impartiality
Ad discliamer
Morbi pretium leo et nisl aliquam mollis. Quisque arcu lorem, ultricies quis pellentesque nec, ullamcorper eu odio.
The day is about to draw to a close out of Europe in the bitcoin price, and the US afternoon is about to get underway. Beyond that, the Asian market will kick off sometime later on this evening, while Europe sleeps. With so much happening in the bitcoin space right now, there is plenty of volatility to go at from an intraday trading strategy perspective. This morning, we noted that we would be trading breakouts on the recently seen correction from yesterday’s highs, and that we would use the levels defined by this correction as our entry and exit points.
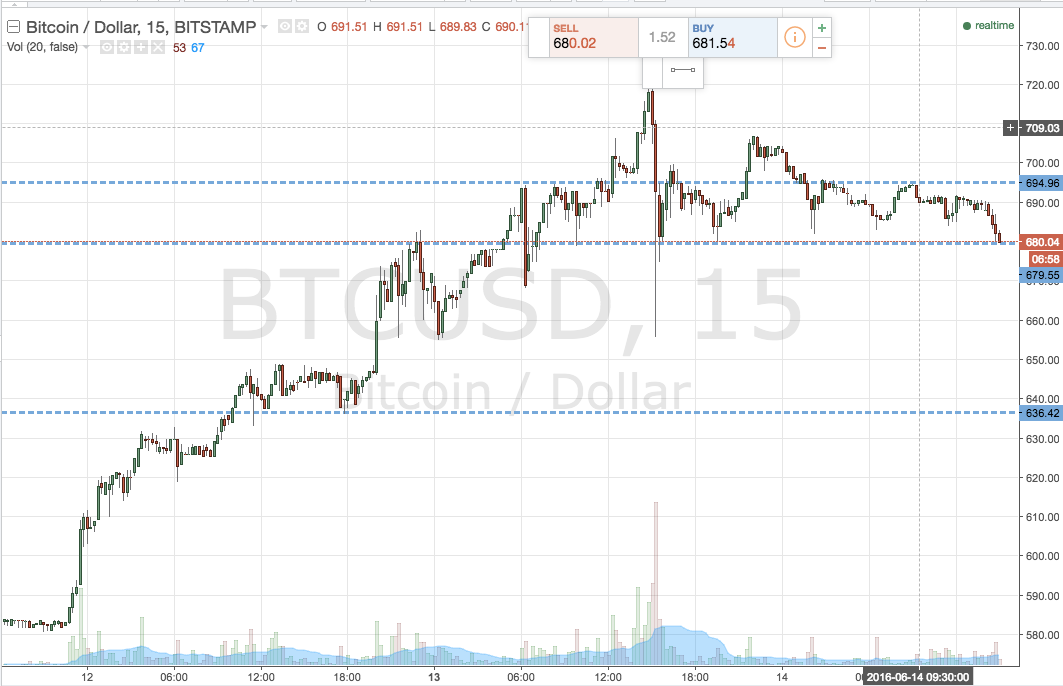
So, with this in mind, and as we head into tonight’s session, how did action today play out, and what did it tell us about how the bitcoin price will likely move tonight? As ever, take a quick look at the chart below before we get going with the details. It is a 15-minute candlestick chart, showing the last 48 hours’ worth of action. Highlighted is our range in focus, again representing our key entry and exit points for the session going forward.

As the chart shows, the range we are looking at this evening is defined by support to the downside at 679 and resistance to the upside at 694. It is a wide enough range to go at the markets with an intrarange strategy, so we will look at a long entry on a bounce from support and a short position on a correction from resistance. Stop losses just the other side of each entry to define risk.
If price breaks and closes above resistance, it will signal a long entry towards an upside target of 705, and we will enter with a stop loss somewhere in the region of 690 to protect our downside.
Looking short, a close below support signals entry towards 670 flat, and a stop at 683 defines risk on the position.
Charts courtesy of Trading View


