So the end of the week is here, and it’s time to take a penultimate look at the bitcoin price market before we kick off the weekend. Price has been pretty volatile across the last few days, and with this volatility has come plenty of opportunity to get in and out of the markets according to our intraday strategy. It has also altered the way we approach things a little. Because of the volatility, we’ve been able to widen out our range somewhat, and while this may sound a bit counterintuitive, we’ve got to head on in to the lower timeframes to get a more accurate representation of what we are looking at. Why? Because of the way price is displayed across the charts. This fresh year has brought with it such a wide high-low divide, that the charts are struggling to display action correctly. By zooming in, and looking at the one minute chart, we can overcome this.
So, with this in mind, let’s move forward and get into the detail of today’s strategy.
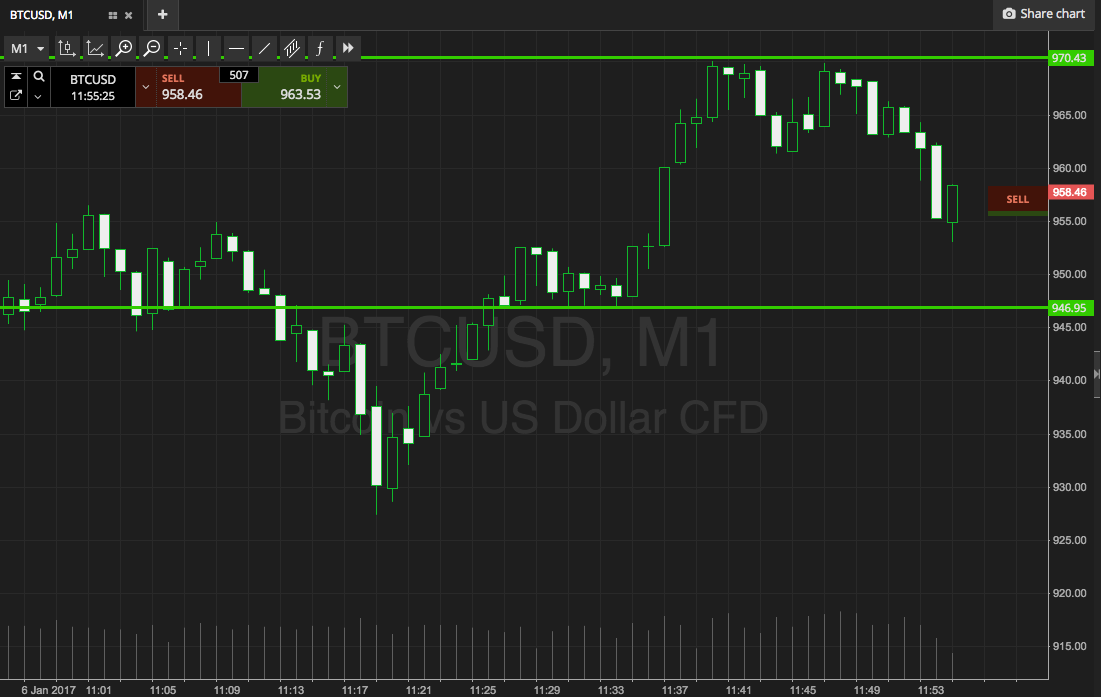
The chart below is a one-minute candlestick chart showing the overnight action. It’s got our range overlaid in green. As ever, take a quick look at that before we get started, to get an idea of our key range in focus.

As illustrated, the range we are looking at for this morning’s European session is defined by in term support to the downside at 946 flat, and in term resistance to the upside at 970.
It’s wider than normal, as mentioned.
We will initially look for a break above, and a close above, resistance. If we get this break, we’ll get in long towards an immediate upside target of 980. A stop loss on this position somewhere in the region of 965 works to keep risk pretty tight.
Looking the other way, a close below support will signal a short entry with a downside target of 935. A stop on this one at 950 looks good.
Charts courtesy of SimpleFX


