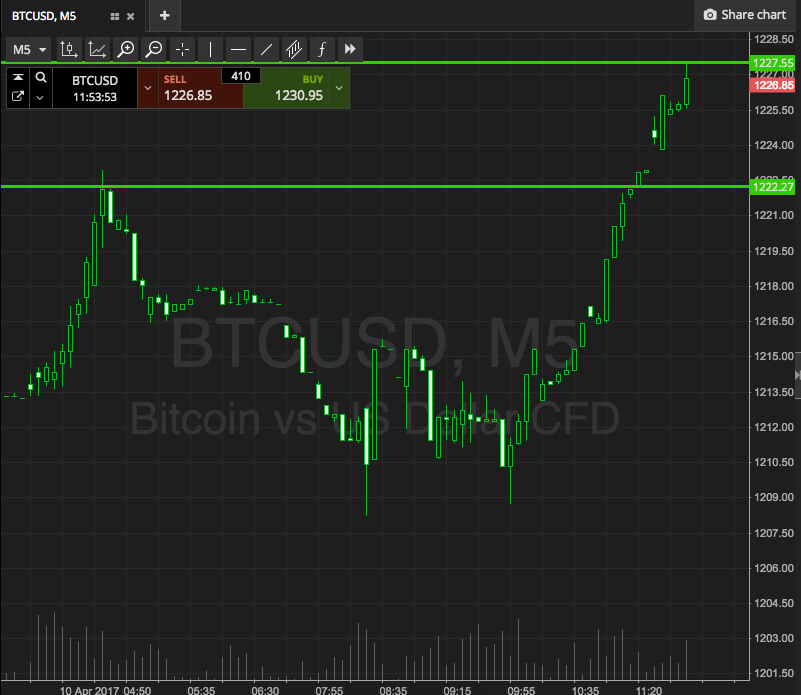
Here we go on a fresh week, then. Things have been getting pretty volatile over the last twenty-four hours or so, and we’ve got plenty to go at during the session out of Europe on Monday. Without wasting too much time looking at what’s happened, then, let’s get to the details. As ever, take a look at the price chart below to get an idea of where action took the bitcoin price heading into our current situation. It’s a five-minute candlestick chart and it’s got our key range overlaid in green.

So, as the chart shows, the range we’re going at today is a pretty tight one, and it’s defined by support to the downside at 1222 and resistance to the upside at 1227. That’s nowhere near enough room to go at things with an intrarange strategy, so we’re going to keep our strategy confined to the parameters of our breakout entries – at least for now.
A break above resistance would put us on alert for a close above that level (the 1227 level noted above) and we’ll look at getting in long if we see that close. It’s a tight range, so we’re going to keep our stop losses and targets pretty tight as well. In this instance, then, we’ll be in long on the close towards an immediate upside target of 1240. A stop on the trade at 1224 looks good from a risk management perspective.
On the other side of the trade, we’ll watch out for a close below support to get us in short. Again we’re going to try and keep things pretty tight here, so we’re looking to target somewhere in the region of 1212. Slightly tighter than the upside entry, and so we’ll proportionately downsize our risk. In this instance, a stop at 1224 works well.
Charts courtesy of SimpleFX


