Another day, another bitcoin price action derived dollar. As we said this morning, action in the bitcoin price has been pretty good to us over the last few days, and we’ve been fortunate enough to get a little bit more of the same today. Well, not exactly, but close enough for rock and roll. We didn’t get the sustained momentum run we were hoping for, and we haven’t yet seen price break the 1300 level. That said, we managed to get in on a pretty clean breakout entry that ran through to a take profit, and now sit pretty much where we started the day (courtesy of a subsequent-to-trade correction), meaning that with any luck we’ll be able to recycle our levels as price mimics its intraday action.
So, with this in mind, and as we head into the US afternoon and beyond, here’s a look at what we’re going for now, and where we are looking to get in and out of the markets according to the rules of our intraday bitcoin price strategy.
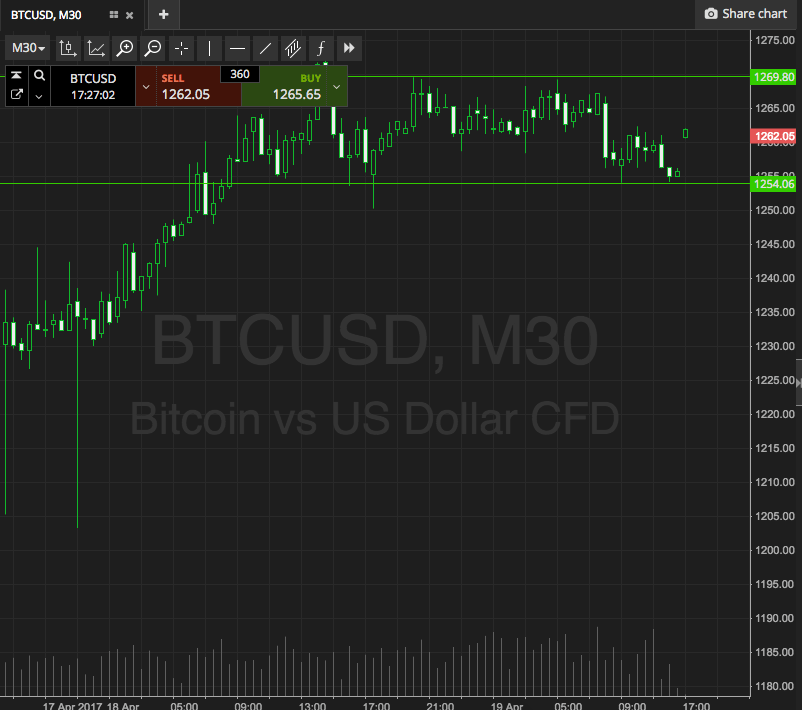
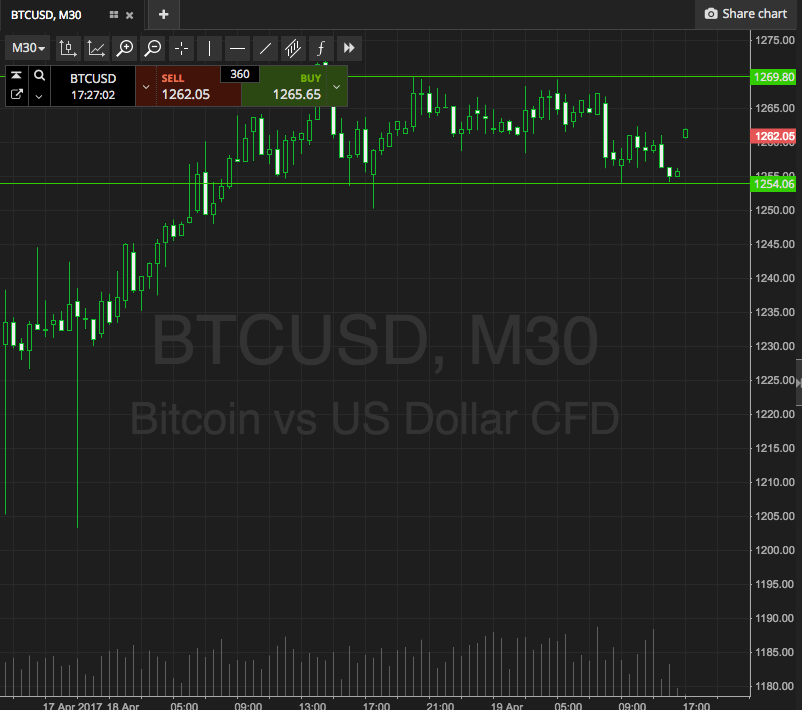
As ever, take a quick look at the chart below before we get started to get an idea of the levels in focus. It’s a thirty-minute chart (we’ve moved to a higher timeframe, from the fifteen-minute chart we’ve been using as late) and it’s got our key range overlaid in green.
 As the chart shows, then, the range we’re looking at tonight is defined by support to the downside at 1254 and resistance to the upside at 1269.
We’re going to keep an eye out for a close below support to validate a downside entry towards an immediate bearish target of 1240. Conversely, if we see price break above resistance, we’ll be on the look out for a close above that level to get us in a long entry towards 1280.
Charts courtesy of SimpleFX


