LITECOIN – LTCUSD TECHNICAL ANALYSIS
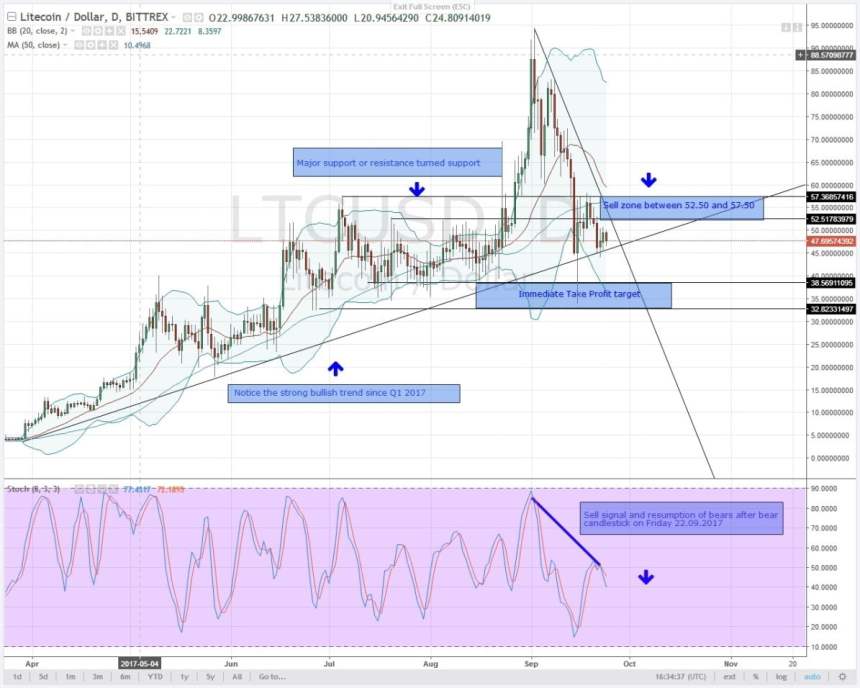
There is an obvious price rejection at 47.00 recorded on Saturday. However, since bears are in charge, my recommendation will be to initiate short positions and this means we wait for any strong sell signal in the 1HR chart and do the honors. Potential sell zones will be at around 52.50 and 57.50 which are bound between 20.07.2017 and July’s highs of 05.07.2017 (refer chart above).
DASH – DASHUSD TECHNICAL ANALYSIS
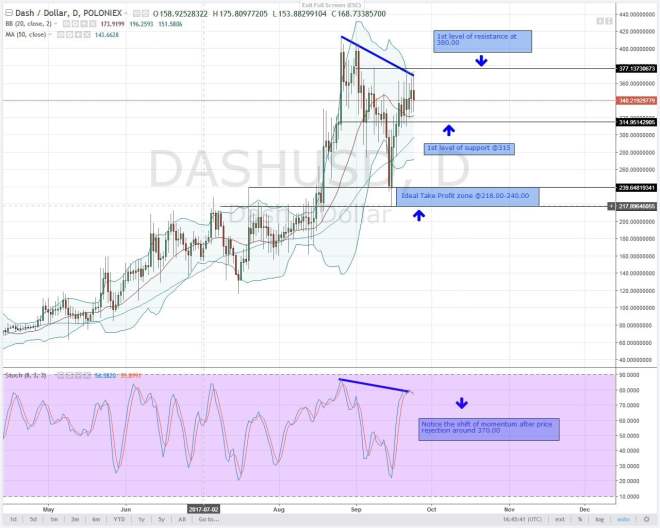
After showing some signs of strengthening, DASH followed the cue and turned bearish just like other altcoins. Our resistance trend line remains our lead and any break above 1st level of resistance above 21.09.2017 and 08.09.2017 highs of 375.00 will disrupt our bear forecast. However, sustained sell pressure means we aim at the first level of support at 315.00 and then this month’s lows of 218.00 which is the lower range of our ideal take profit.
IOTA – IOTUSD TECHNICAL ANALYSIS
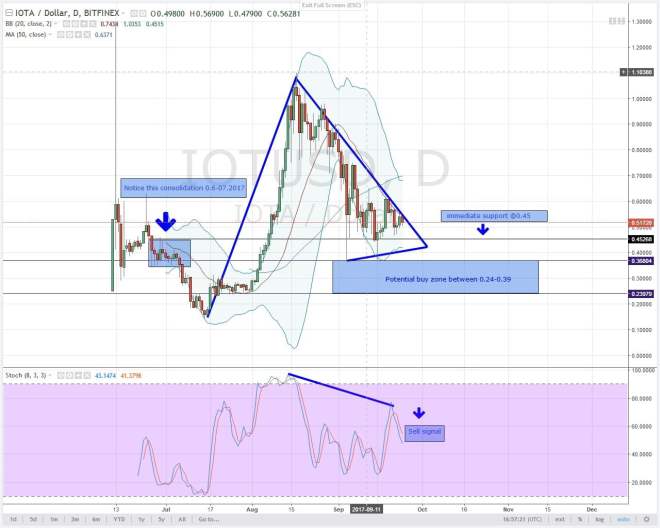
It was a pretty calm affair for this pair over the weekend. With price keeping a narrow range between 0.5424 and 0.5041, our resistance trend line remained intact and in fact, price closed lower at 0.5181 on Saturday. Stochastic has a clear sell signal with %k and %d diverging signaling bear momentum. 0.45 looks to be a respectable price level looking at what happened late June-early July 2017 when price consolidate and broke lower towards 0.24 and eventually 0.15. If bears rally and break below support trend line of this bullish flag then aim 0.24 and then 0.15.
MONERO-XMRUSD TECHNICAL ANALYSIS
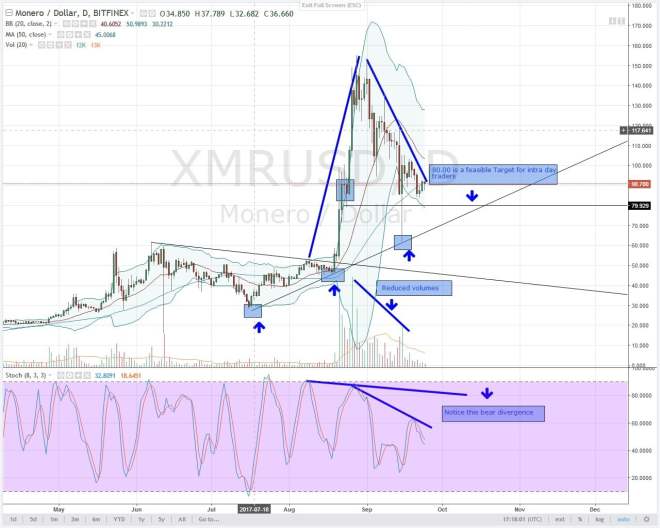
Checking that Wednesday 20.09.2017 bear candlestick, it is worth noting that price has been testing its Hi-Lo of 96.25 and 84.00. With consequent candlesticks, a typical bearish harami pattern has been formed. This is a trend continuation pattern as price failed to close above 96.25 and in essence above resistance trend line which in honesty is turning to be a crucial ceiling. Again, an attempt for higher price movement and test of 96.00 over the past two days is being pumped by dismissal volumes. Check the attached chart and observe. Bears will be completely in charge if and only if there is a bear close below 80.00 and that should be a feasible target for intra-day traders.
NEM – NEMUSD TECHNICAL ANALYSIS
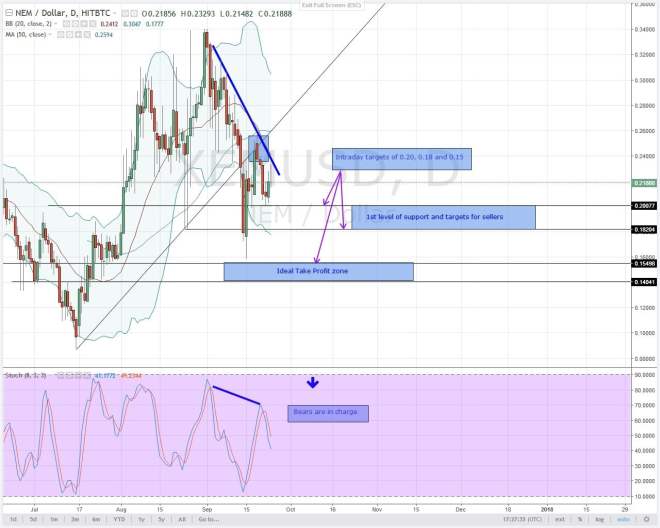
Three things to note here, 24.09.2017 candlestick is still finding it hard to confirm the bullish candlestick formed on Saturday, 23.09.2017. Therefore, as long as price remains below 50 period MA and stochastics don’t turn bullish, we remain sellers. Good entries will be on the 1hr charts when there is stochastics sell signal. Intra-day traders should then aim for 0.20, 0.18 and then swing traders ideal TP of 0.15 or 0.14
Contributed by Dalmas Ngetich, an expert with 3 years in Forex, Commodity and Cryptocurrency trading.

All charts courtesy of Trading View

