Reason to trust

How Our News is Made
Strict editorial policy that focuses on accuracy, relevance, and impartiality
Ad discliamer
Morbi pretium leo et nisl aliquam mollis. Quisque arcu lorem, ultricies quis pellentesque nec, ullamcorper eu odio.
With Bitcoin constantly testing a big resistance zone price predictions are coming thick and fast. The longer BTC stays below the $4,000 barrier the more likely a move to the downside will occur. Some analysts however think it could well move above this in the coming months.
Bitcoin in Bullish Territory, Above 0.5 Fib
Over the past week Bitcoin has been trading steadily higher above $3,900. However, BTC has failed to break this level since late February when it hit a monthly high of $4,200, but albeit very briefly. An intraday high of $3,950 was touched a few hours ago but Bitcoin fell back instantly to $3,875. Since then it has rapidly recovered back over $3,900 in the past couple of hours indicating bullish momentum.
Experienced trader and crypto analyst going by the twitter handle of ‘fil₿fil₿’ has produced another couple of charts to attempt a prediction at further moves for Bitcoin. He states that Bitcoin is a bull and has done enough to show this. The significant thing to note is that BTC has remained above the 0.5 Fibonacci level since February 18.
BITCOIN – [IS A BULL] – #BTCUSD chart https://t.co/Nb8YaImC9t
— filbfilb (@filbfilb) March 8, 2019
Market action shows repeated patterns recently with inverted head and shoulders being a common one. Three higher lows since December’s dump to $3,200 are also significant. BTC dips have been around $3,400, $3,650 and $3,800, each preceding one lower than the following. Other bullish signals include a MACD cross trending above zero and a Chaikin Money Flow (CMF) indicating strong buying pressure.
If Bitcoin breaks below $3,400 it would signal lower lows and more bearish action possibly sending it below $3,000 as many others have predicted.
$5,000 a Major Psychological Level
If BTC remains above this key 0.5 Fib level it could turn bullish quickly which may result in a run up to $5,000 by May according to ‘fil₿fil₿’s charts. Just as $4k has been, $5k will also be a major psychological resistance level.
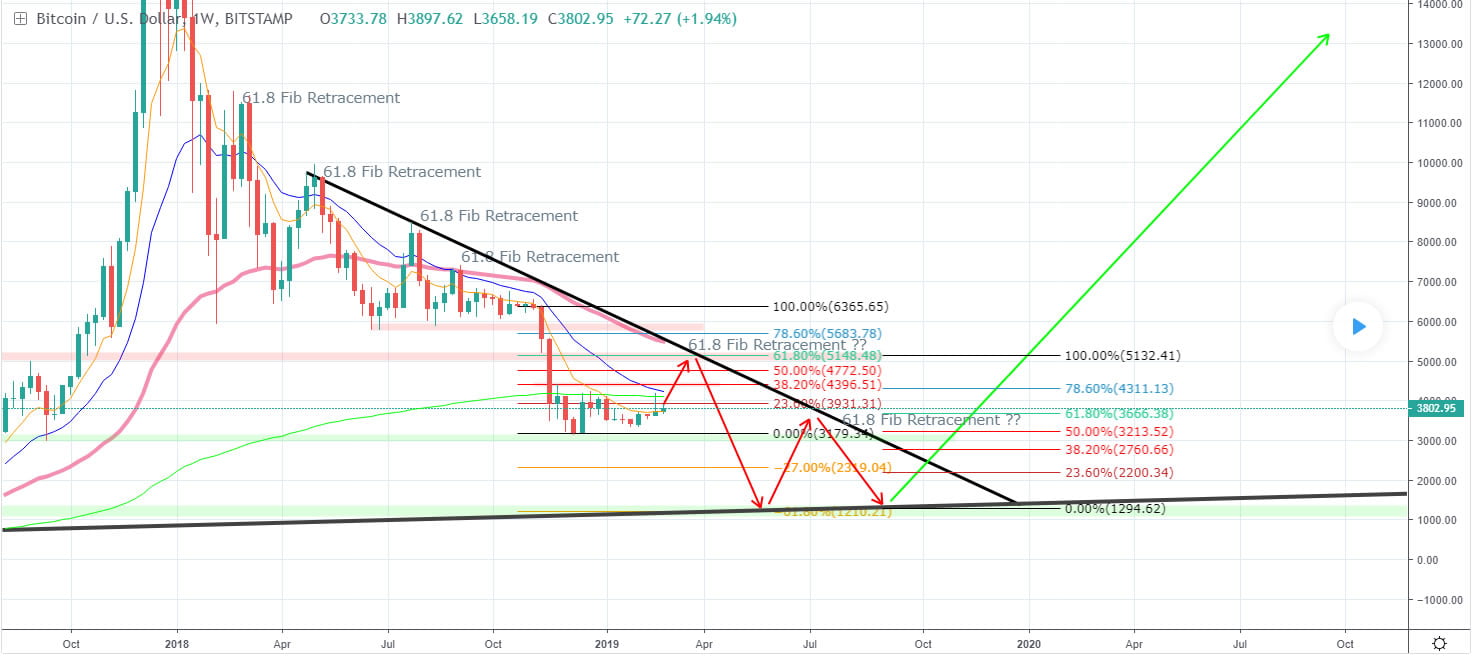
Other traders have predicted a longer term recovery, possibly by the end of 2019. Using the key long term 61.8 Fib retracement level Bitcoin could bounce off this at $5,000 only to dump again below $1,500 according to this rather extreme scenario.

By October 2019 a breakout may occur sending BTC back through this down trend line and through $5,000 again by the end of the year. In 2020 the only way is up as another major bull run has initiated.
Price predictions are purely speculation based on previous market actions so should not be taken as gospel. The primary take from nearly all crypto analysts though is that there will be a trend reversal and it is likely to come at some time this year. Until then, happy hodling and accumulating.
Image from Shutterstock


