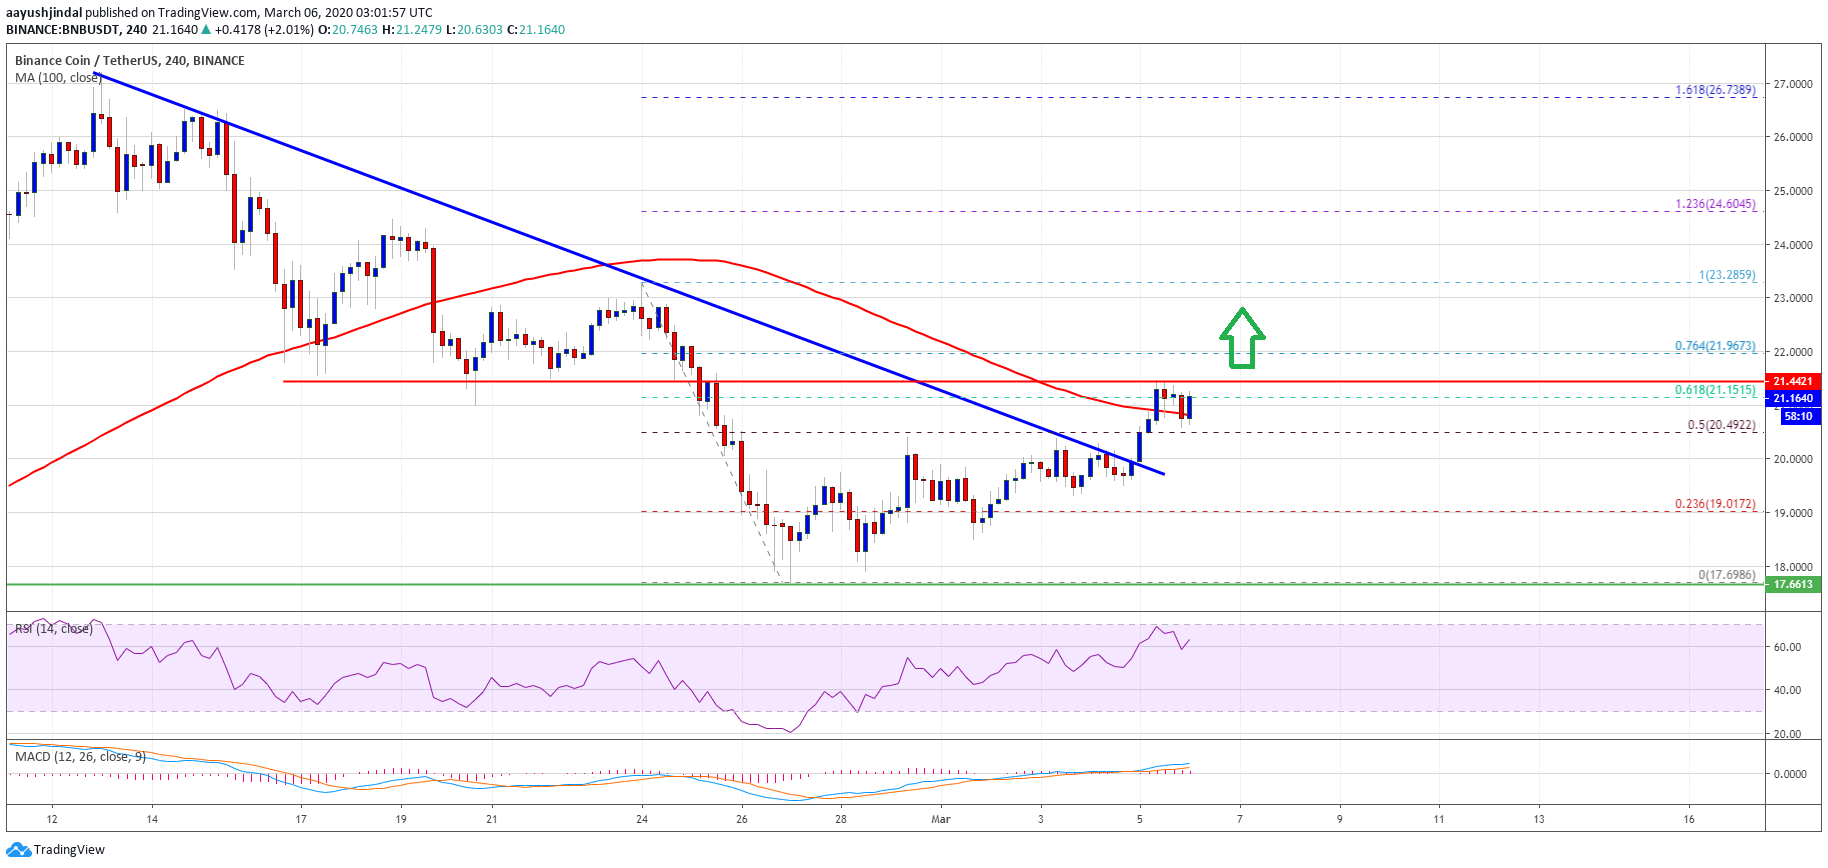
Binance coin price is gaining bullish momentum above the $20.50 resistance against the USDT. BNB price action suggests bitcoin could also start a decent upward move if it remains stable above $9,000.
- Binance coin price is up more than 3% and it recently broke the $21.00 resistance against the USDT.
- The price is likely to rise further if it clears the $21.45 and $21.50 resistance levels.
- There was a break above a major bearish trend line with resistance near $19.98 on the 4-hours chart of the BNB/USDT pair (data source from Binance).
- Bitcoin is trading above $9,000 and if the market sentiment improves, it could rally above $9,200.
Binance Coin Price Gaining Traction
In the past few sessions, binance coin followed a bullish path above the $19.00 and $20.00 resistance levels. BNB price even settled above the $20.00 resistance area and the 100 simple moving average (4-hours).
It opened the doors for more gains above the 50% Fib retracement level of the last key decline from the $23.25 high to $17.69 low. The price is now trading above the $21.00 resistance area.
During the rise, there was a break above a major bearish trend line with resistance near $19.98 on the 4-hours chart of the BNB/USDT pair. It seems like the bulls are currently facing hurdles near the $21.15 and $21.20 levels.

The 61.8% Fib retracement level of the last key decline from the $23.25 high to $17.69 low is also acting as a strong resistance. If binance coin cryptocurrency surges above the $21.15 and $21.20 levels, it could continue to rise towards the $22.00 and $23.00 levels.
The market sentiment is also likely to improve if the price gains pace above $21.20 and it might help bitcoin in rising steadily towards $9,200 or $9,340.
What If BNB Cryptocurrency Dives?
If BNB fails to clear the $21.15 and $21.20 resistance levels, it could start a downside correction. An initial support is seen near the $20.50 level. If the bulls fail to defend the $20.50 support, the price might retest the $20.00 support area.
Any further losses could push the bulls on the back foot and the price is likely to slide towards the $18.80 support level in the near term. Overall, the current price action is positive and there are chances of more gains above $21.20.
Technical Indicators
4-Hours MACD – The MACD for BNB/USDT is slowly gaining momentum in the bullish zone.
4-Hours RSI (Relative Strength Index) – The RSI for BNB/USDT is currently well above the 55 level.
Major Support Levels – $20.50, $20.00 and $18.80.
Major Resistance Levels – $21.15, $21.20 and $22.00.


