Reason to trust

How Our News is Made
Strict editorial policy that focuses on accuracy, relevance, and impartiality
Ad discliamer
Morbi pretium leo et nisl aliquam mollis. Quisque arcu lorem, ultricies quis pellentesque nec, ullamcorper eu odio.
There is no better time to accumulate an asset than when it its price is on the floor. Bitcoin has certainly been in that position for the past four months as it has failed to break major resistance at $4,000 and lulled around this price level.
UTXOs Higher Than January 2018
That is not to say that there has been no interest in the digital asset, in fact quite the opposite as one metric has surpassed its all-time high from January 2018 and has stepped up in 2019.
UTXOs are unspent transaction outputs. For the Bitcoin blockchain it is an output that has yet to be spent as a new input transaction. UTXOs are processed continuously and are responsible for beginning and ending each transaction. A transaction confirmation results in the removal of spent coins from the UTXO.
During the crypto peak at the end of 2017 and early 2018 UTXO levels reached 67 million before falling sharply as the great selloff accelerated. Around August last year the trend reversed and they started to increase again, the curve steepening as this year began. Levels of unspent transaction outputs have just surpassed their previous ATH and are a definitive sign that Bitcoin accumulation is real.
UTXOs have now surpassed all time highs and stepped up in 2019; the accumulation is real. pic.twitter.com/1o98KbLieU
— filbfilb (@filbfilb) March 28, 2019
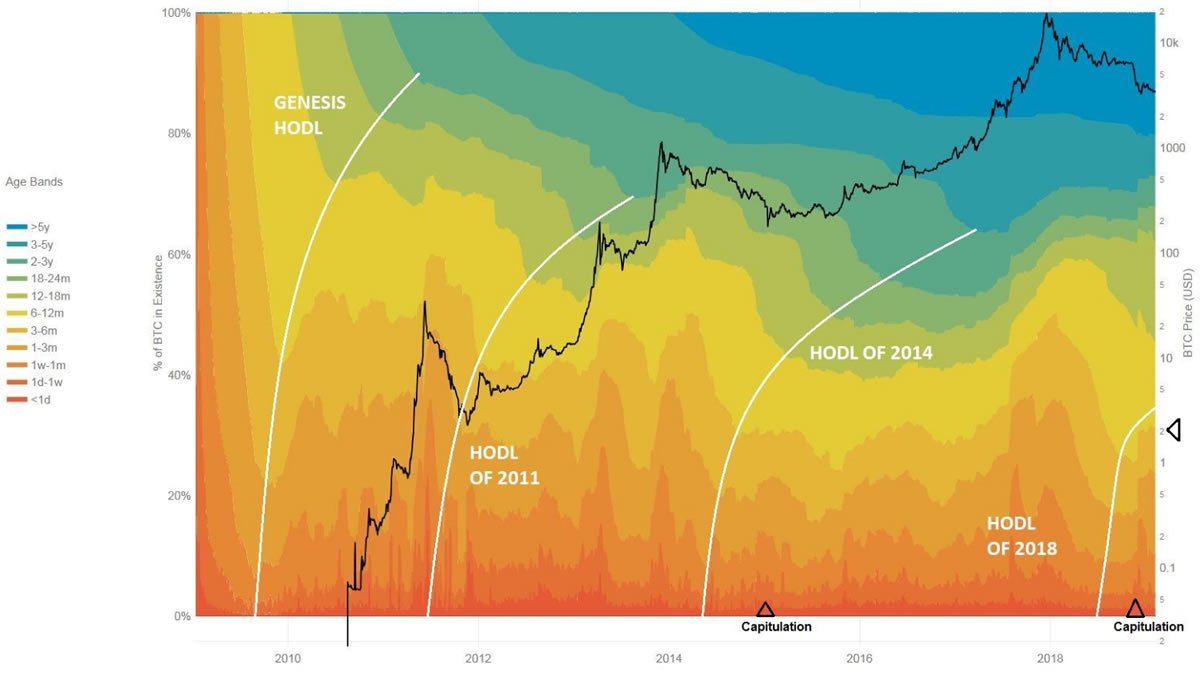
Hodl waves are another indicator that people are buying and holding Bitcoin. This one has been updated by crypto analyst fil₿fil₿ who has included the historical times that Bitcoin accumulation occurred before the next big bullrun.

Looking at the chart it is clear that the 2018 hodl was very pronounced and picked up all the way through consolidation. fil₿fil₿ observes that falling from 6k showed a big uptick in coins moving between the lower ranges.
April Could be Big For Bitcoin
Historically Bitcoin has rallied year on year in April with only two years when it saw a decline over the previous. This occurred during the crypto winter of 2014/2015. Last year Bitcoin was very strong in April with a gain of 40% over the month and 33% over the same period the previous year.
Observers are hoping for a similar upswing in momentum this year and the accumulation could be the catalyst to push prices through resistance levels and send BTC to $5,000 or higher.
historic $BTC prices in the month of April:
2011 +358%
2012 +2%
2013 +43%
2014 -3.5%
2015 -3%
2016 +8%
2017 +29%
2018 +33.5%
2019 ?????— #333kByJuly2025 (@CarpeNoctom) March 28, 2019
At the time of writing Bitcoin was hovering around a weekly high of $4,080. The general trend over the past month has been positive with BTC gaining 6% to its current levels. Since November’s big dump from $6k Bitcoin has surpassed $4,000 at least five times but failed to break the wall of resistance here. All indicators now point to a slow and steady accumulation and a possible breakthrough in April to take prices up towards the $5,000 range.
Image from Shutterstock


