
Reason to trust
How Our News is Made
Strict editorial policy that focuses on accuracy, relevance, and impartiality
Ad discliamer
Morbi pretium leo et nisl aliquam mollis. Quisque arcu lorem, ultricies quis pellentesque nec, ullamcorper eu odio.
- Bitcoin price is declining and it is now trading below the $7,200 support against the US Dollar.
- The price is likely to struggle near the $7,200 and $7,280 levels if it corrects higher.
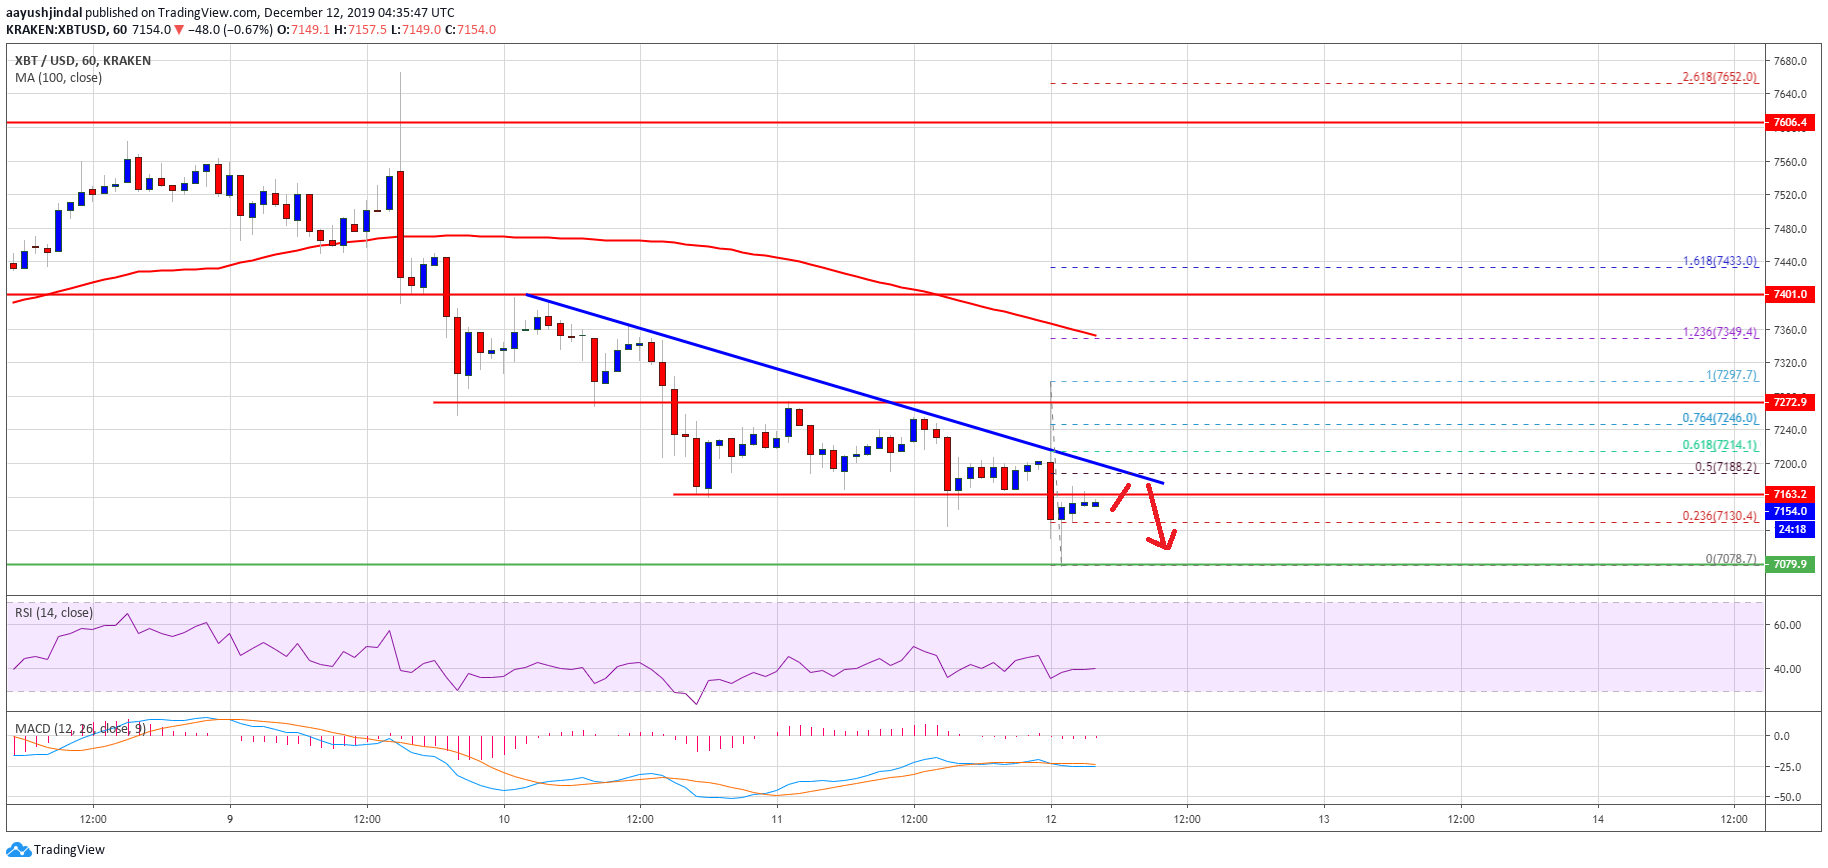
- There is a key bearish trend line forming with resistance near $7,190 on the hourly chart of the BTC/USD pair (data feed from Kraken).
- The pair remains at a risk of a downside break below the $7,000 support area in the near term.
Bitcoin price is sliding below key supports against the US Dollar. BTC remains at a risk of more losses below $7,000 and $6,800 if it stays below $7,280.
Bitcoin Price Analysis
Yesterday, we saw an increase in selling on bitcoin below the $7,300 support against the US Dollar. BTC price declined further and broke a few key supports near $7,280 and $7,200.
Moreover, there was a close below the $7,200 support and the 100 hourly simple moving average. Finally, the price spiked below the $7,100 level and tested the $7,080 support.
A low was formed near $7,078 and the price is currently correcting higher. It is trading above the $7,150 level. Besides, there was a break above the 23.6% Fib retracement level of the recent decline from the $7,297 high to $7,078 low.
An immediate resistance is near the $7,165 level (the recent breakdown support). The first key resistance is near the $7,200 level. Additionally, the 50% Fib retracement level of the recent decline from the $7,297 high to $7,078 low is near $7,190.
More importantly, there is a key bearish trend line forming with resistance near $7,190 on the hourly chart of the BTC/USD pair. Therefore, bitcoin price is likely to struggle near the $7,190 and $7,200 levels.
If there is an upside break above the $7,200 resistance, the price could recover towards the $7,280 resistance. The next major resistance is near $7,340, the 100 hourly SMA, and $7,400.
On the downside, an initial support is near the $7,100 and $7,080 levels. If there is a downside break below the $7,080 area, the bears are likely to aim a clear break below the $7,000 support area in the near term.
Looking at the chart, bitcoin price is under a lot of pressure below the $7,200 area. Thus, there are high chances of another breakdown below the $7,000 support. The main target for the bears could be $6,600 or $6,500.
Technical indicators:
Hourly MACD – The MACD is slowly moving in the bearish zone.
Hourly RSI (Relative Strength Index) – The RSI for BTC/USD is currently flat near the 40 level.
Major Support Levels – $7,080 followed by $7,000.
Major Resistance Levels – $7,200, $7,280 and $7,340.


