
Reason to trust
How Our News is Made
Strict editorial policy that focuses on accuracy, relevance, and impartiality
Ad discliamer
Morbi pretium leo et nisl aliquam mollis. Quisque arcu lorem, ultricies quis pellentesque nec, ullamcorper eu odio.
Bitcoin price recovered above $48,000, but it failed near $50,000 against the US Dollar. BTC is now holding gains above $47,000 and it is likely to make another attempt to surpass $50,000.
- Bitcoin is consolidating gains above the $47,000 and $46,500 support levels.
- The price is now trading well above $47,000 and the 100 hourly simple moving average.
- There is a key declining channel or a bullish flag forming with resistance near $49,000 on the hourly chart of the BTC/USD pair (data feed from Kraken).
- The pair could start a strong increase once it clears $49,000 and $50,000 in the near term.
Bitcoin Price is Showing Positive Signs
After struggling to clear the $50,000 resistance, bitcoin started a downside correction. BTC declined below the $49,500 and $49,000 support levels.
The price even traded below the 23.6% Fib retracement level of the upward move from the $43,000 swing low to $50,190 high. It even declined below the $48,000 support level. However, the bulls were able to protect the $47,000 support zone.
The price remained stable above the 100 hourly simple moving average, which is currently at $47,100. Bitcoin also remained well bid above the 50% Fib retracement level of the upward move from the $43,000 swing low to $50,190 high.
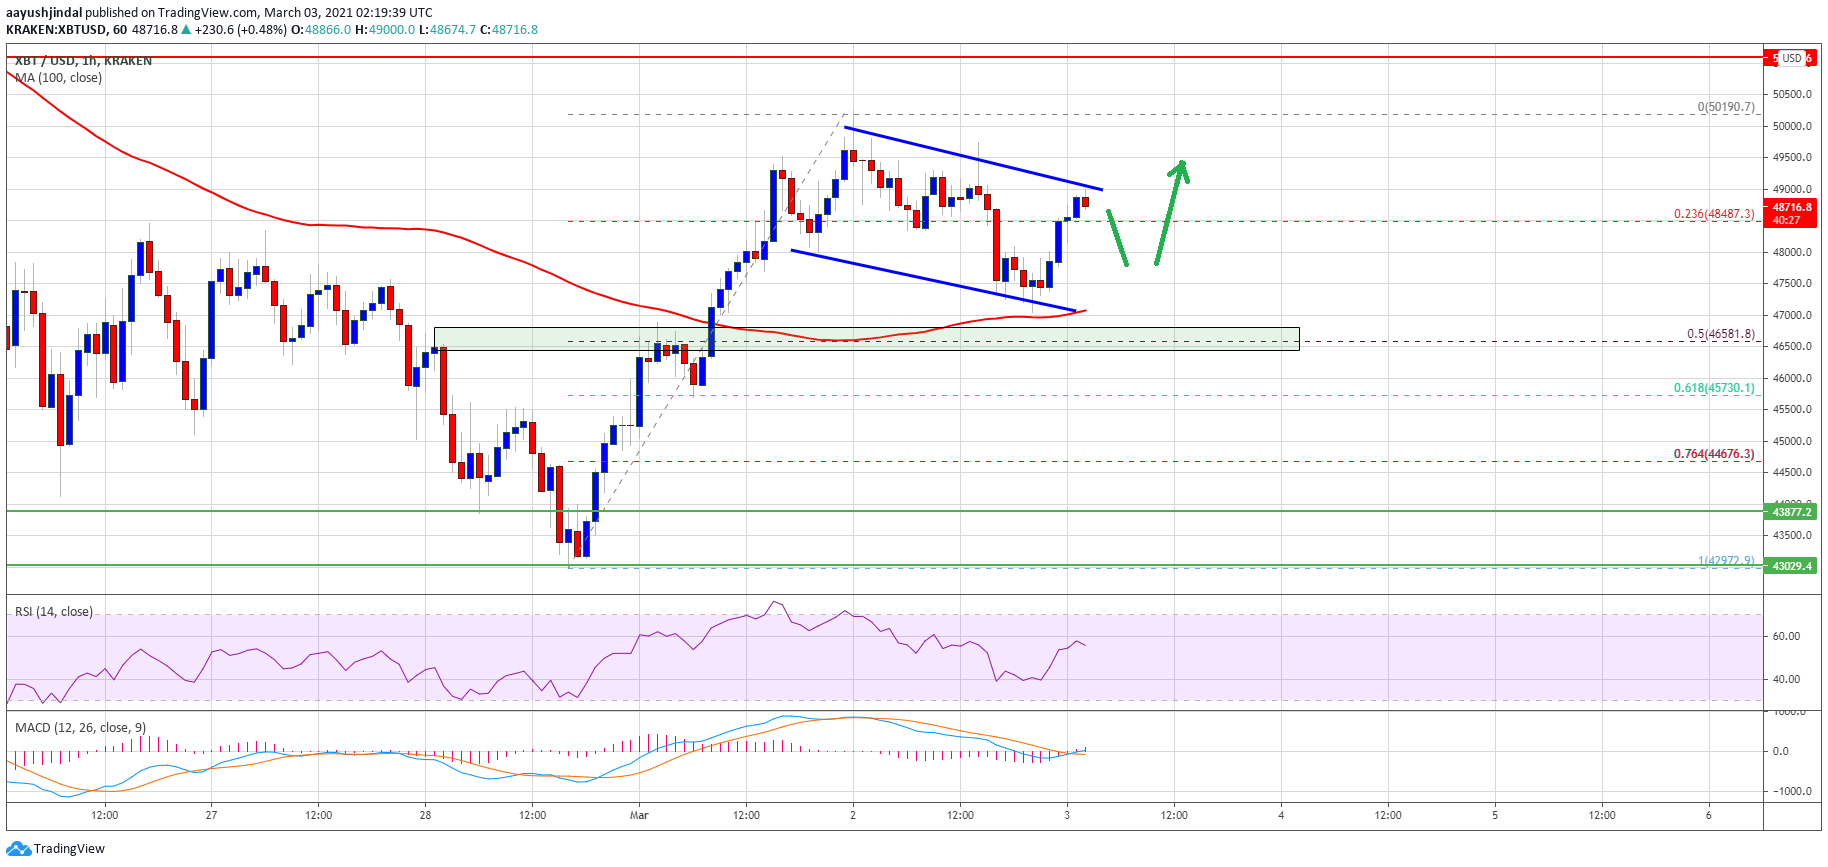
Source: BTCUSD on TradingView.com
It seems like there is a key declining channel or a bullish flag forming with resistance near $49,000 on the hourly chart of the BTC/USD pair.
If there is an upside break above the channel resistance, there are high chances of a push above the $50,000 resistance. The next major resistance is near $52,000, above which the bulls are likely to take control.
Fresh Dip in BTC?
If bitcoin fails to continue higher above the $49,000 and $50,000 resistance levels, there could be a fresh decline. The first key support on the downside is near the $47,500 level.
The next major support is near the $47,000 level and the 100 hourly simple moving average. The main breakdown zone is now forming near the $46,500 level, below which the price might dive to $43,000 in the near term.
Technical indicators:
Hourly MACD – The MACD is now gaining momentum in the bullish zone.
Hourly RSI (Relative Strength Index) – The RSI for BTC/USD is now well above the 50 level.
Major Support Levels – $47,000, followed by $46,500.
Major Resistance Levels – $49,000, $50,000 and $52,000.


