
Reason to trust
How Our News is Made
Strict editorial policy that focuses on accuracy, relevance, and impartiality
Ad discliamer
Morbi pretium leo et nisl aliquam mollis. Quisque arcu lorem, ultricies quis pellentesque nec, ullamcorper eu odio.
Bitcoin price started a downside correction from the $60,000 resistance against the US Dollar. BTC is now approaching a major support zone near $56,200 and $56,000.
- Bitcoin formed a short-term top near $60,000 and started a downside correction.
- The price is now trading near the $57,000 support and the 100 hourly simple moving average.
- There is a key rising channel forming with support near $56,150 on the hourly chart of the BTC/USD pair (data feed from Kraken).
- The pair is likely to continue higher as long as there is no downside break below the $56,000 support.
Bitcoin Price is Losing Momentum
There was an upside extension in bitcoin above the $59,500 level. BTC even climbed towards the $60,000 level before the bears took a stand. A high is formed near $60,040 before there was a dip.
There was a break below the $58,500 and $58,000 support levels. The price dipped below the 23.6% Fib retracement level of the upward move from the $53,761 swing low to $60,040 high. It is now trading near the $57,000 support and the 100 hourly simple moving average.
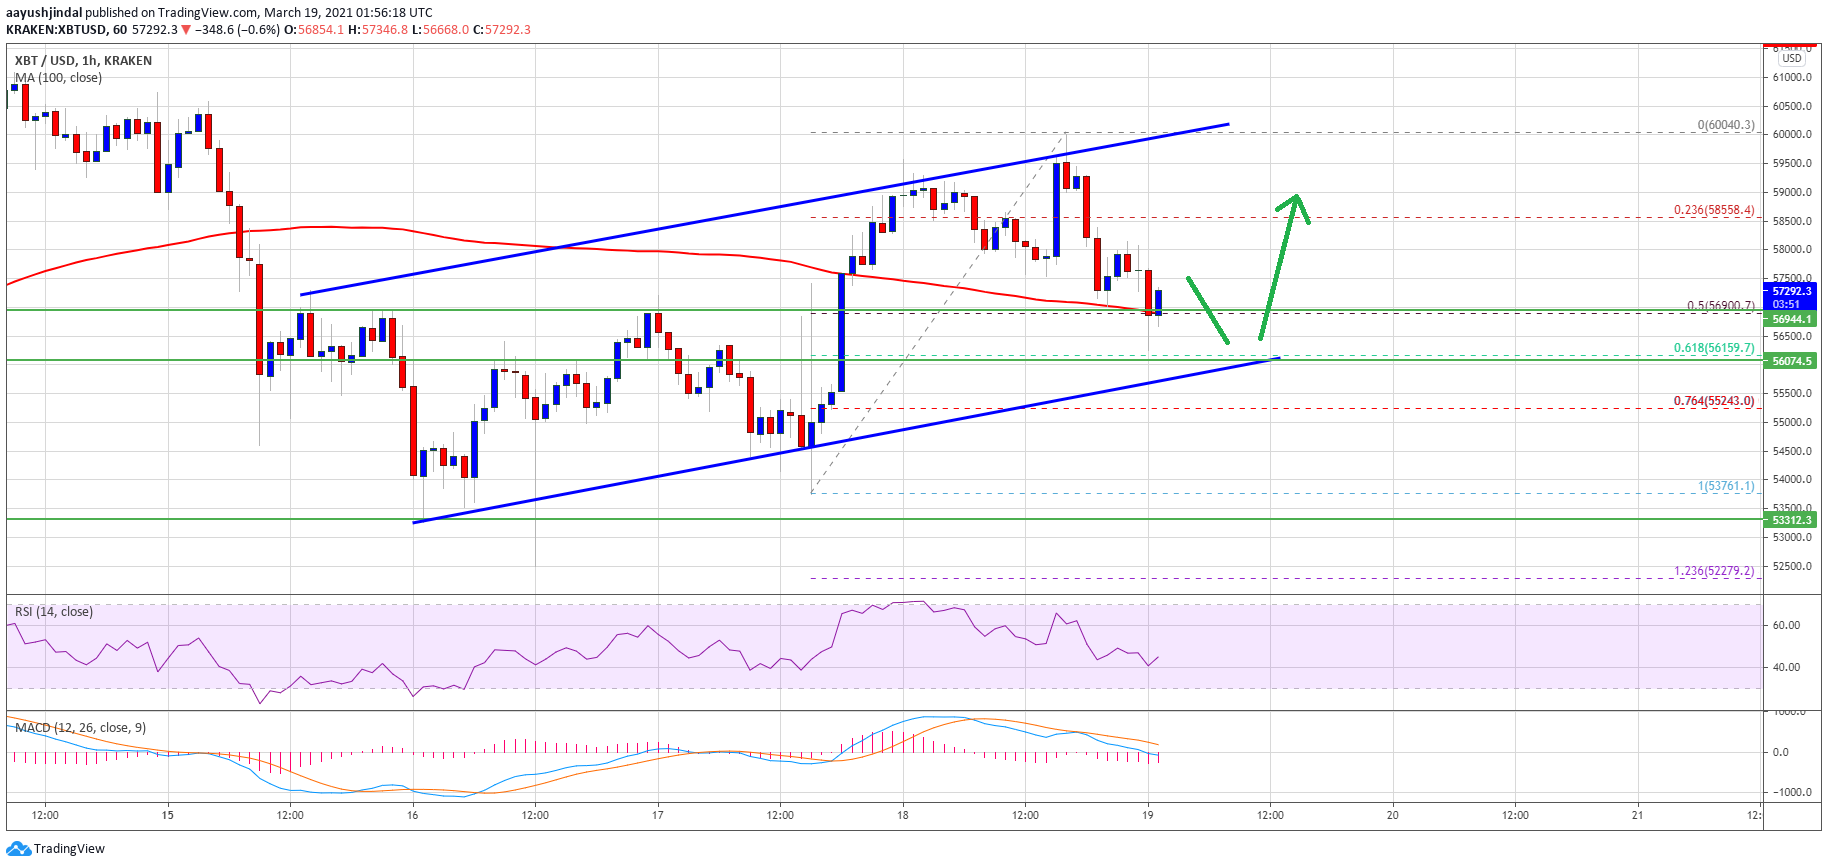
Source: BTCUSD on TradingView.com
The bulls are defending the 50% Fib retracement level of the upward move from the $53,761 swing low to $60,040 high. There is also a key rising channel forming with support near $56,150 on the hourly chart of the BTC/USD pair.
If there is a downside break below the $56,200 and $56,000 support levels, there is a risk of a sharp decline. In the stated case, the price is likely to dive towards the $53,500 level in the near term. An intermediate support could be near the $55,000 level.
Fresh Increase in BTC?
If bitcoin stays above the $56,200 and $56,000 support levels, it could start a fresh increase. An initial resistance on the upside is near the $58,500 level.
A clear break above the $58,500 level may possibly push the price towards the $60,000 resistance zone. Any more gains is likely to set the tone for a move towards the $61,500 level or even a new all-time high in the coming days.
Technical indicators:
Hourly MACD – The MACD is now gaining momentum in the bearish zone.
Hourly RSI (Relative Strength Index) – The RSI for BTC/USD is now below the 50 level.
Major Support Levels – $57,000, followed by $56,000.
Major Resistance Levels – $58,500, $60,000 and $61,500.


