
Reason to trust
How Our News is Made
Strict editorial policy that focuses on accuracy, relevance, and impartiality
Ad discliamer
Morbi pretium leo et nisl aliquam mollis. Quisque arcu lorem, ultricies quis pellentesque nec, ullamcorper eu odio.
- Bitcoin price is trading with a bearish angle below the $8,880 resistance against the US Dollar.
- The price is likely to continue lower below the $8,640 and $8,600 support levels.
- There is a short term breakout pattern forming with resistance near $8,740 on the hourly chart of the BTC/USD pair (data feed from Kraken).
- The bears remain in control unless the price climbs above $8,880 and $9,000.
Bitcoin price is under a lot of pressure below $8,880 against the US Dollar. BTC could decline significantly if it breaks the $8,640 and $8,600 support levels.
Bitcoin Price Analysis
Yesterday, we saw a couple of bearish patterns for bitcoin below the $8,880 resistance against the US Dollar. BTC remained in a bearish zone below the $8,800 level and the 100 hourly simple moving average.
The last rejection was near the $8,780 level and the 100 hourly SMA. A high was formed near $8,784 before the price declined below $8,700. Moreover, the price traded below $8,680 and it is currently testing the $8,640 support area.
If there is an upside correction, the $8,710 level is an immediate resistance. Besides, the 50% Fib retracement level of the recent decline from the $8,784 high to $8,636 low is also near the $8,710 level.
The main resistances on the upside are near the $8,740 and $8,750 levels. More importantly, there is a short term breakout pattern forming with resistance near $8,740 on the hourly chart of the BTC/USD pair.
An intermediate resistance is near the $8,730 level. It represents the 61.8% Fib retracement level of the recent decline from the $8,784 high to $8,636 low. Therefore, bitcoin price might struggle to break the $8,730-$8,750 resistance area.
Furthermore, BTC needs to climb above the key $8,800 and $8,880 resistance levels to move into a positive zone and start a decent recovery. The next resistance is near $9,000, followed by $9,250.
Conversely, the price might continue to move down if it fails to climb above $8,780, $8,800 and $8,880. An initial support is near the $8,640 level. The next key support is near the $8,600 level, below which the price is likely to accelerate lower towards the $8,500 and $8,300 support area.
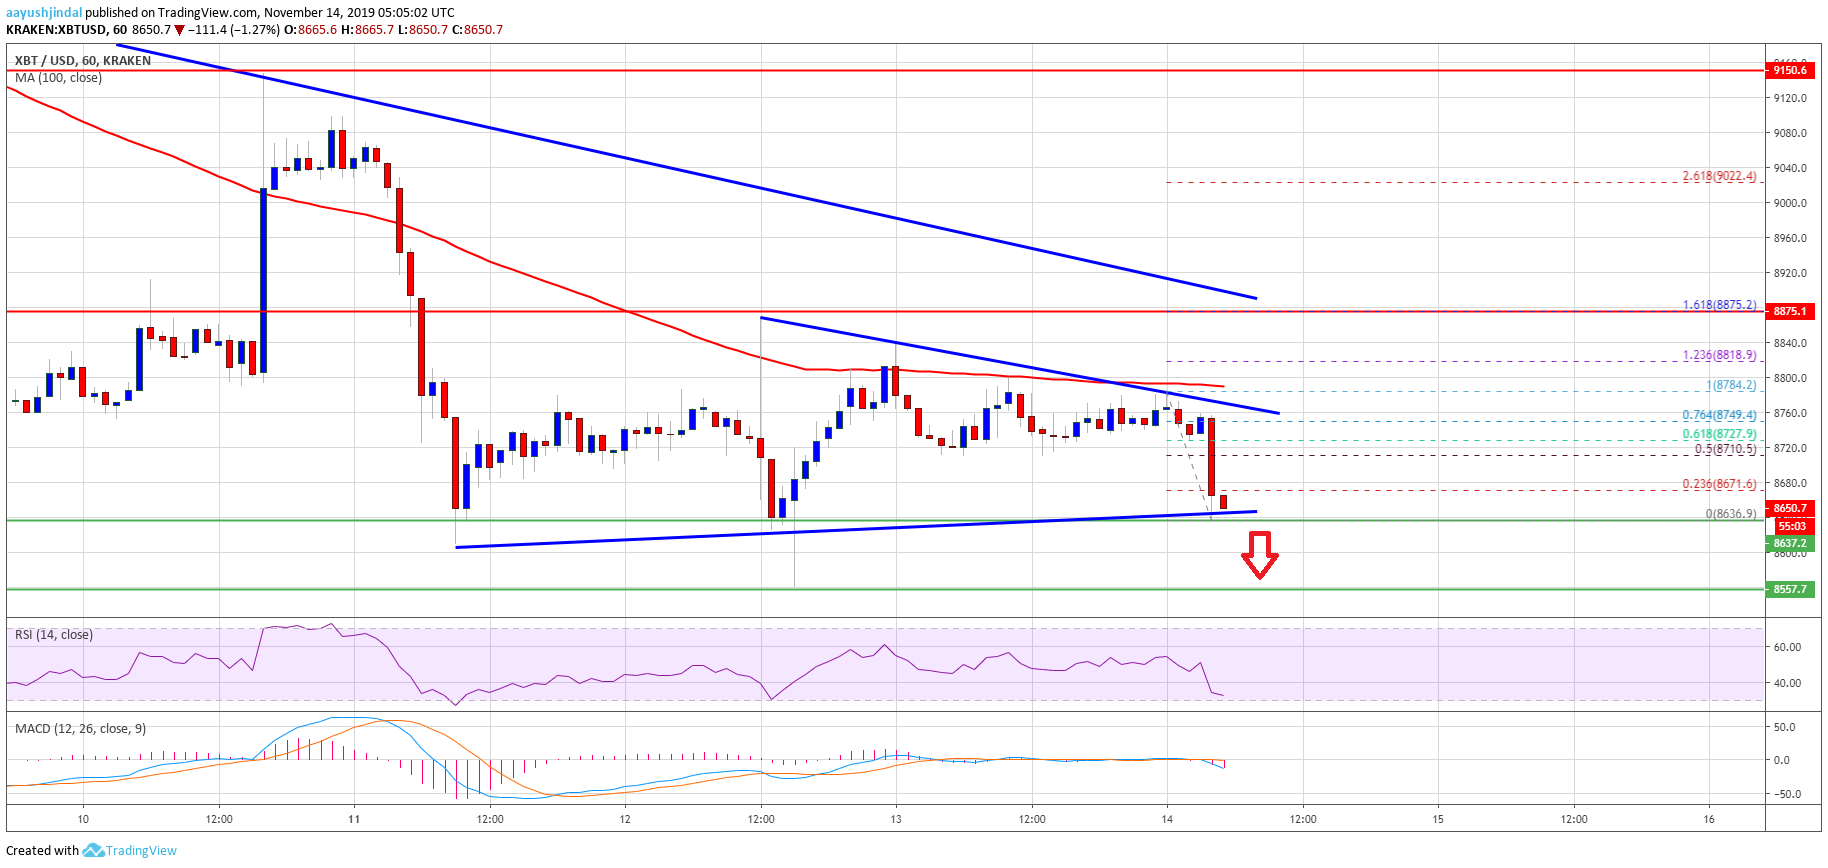
Looking at the chart, bitcoin is facing a lot of resistances on the upside, starting with $8,780 and up to $9,000. A successful daily close above $9,000 is needed for a fresh increase in the coming days.
Technical indicators:
Hourly MACD – The MACD is currently gaining momentum in the bearish zone.
Hourly RSI (Relative Strength Index) – The RSI for BTC/USD is declining and it is now well below the 50 level.
Major Support Levels – $8,640 followed by $8,600.
Major Resistance Levels – $8,780, $8,800 and $8,880.