Reason to trust
How Our News is Made
Strict editorial policy that focuses on accuracy, relevance, and impartiality
Ad discliamer
Morbi pretium leo et nisl aliquam mollis. Quisque arcu lorem, ultricies quis pellentesque nec, ullamcorper eu odio.
Bitcoin extended its rally above the $8,800 resistance against the US Dollar. However, BTC price might now correct lower towards $8,400 or $8,300 before a fresh increase.
- Bitcoin price climbed to a new 2020 high at $8,898 against the US Dollar.
- The price is now showing signs of a downside correction below $8,700 and $8,600.
- There is a key bullish trend line forming with support near $8,300 on the hourly chart of the BTC/USD pair (data feed from Kraken).
- The pair is likely to find a strong support near $8,400 or $8,300 if it dips further.
Bitcoin Rally Pauses But Not Likely Over
Yesterday, bitcoin started a nice uptrend above the $8,200 and $8,400 resistance levels against the US Dollar. Later, BTC price traded in a range before rallying again above the $8,500 and $8,600 resistance levels.
Moreover, the price jumped above the $8,800 level (as discussed yesterday) and settled nicely above the 100 hourly simple moving average. A new 2020 high is formed near $8,898 and the price is currently correcting lower.
It already broke the 23.6% Fib retracement level of the recent surge from the $8,038 low to $8,898 high. An initial support on the downside is near the $8,600 and $8,620 levels.
The next support could be $8,460 or the 50% Fib retracement level of the recent surge from the $8,038 low to $8,898 high. The main support and buy zone could be near the $8,400 and $8,300 levels.
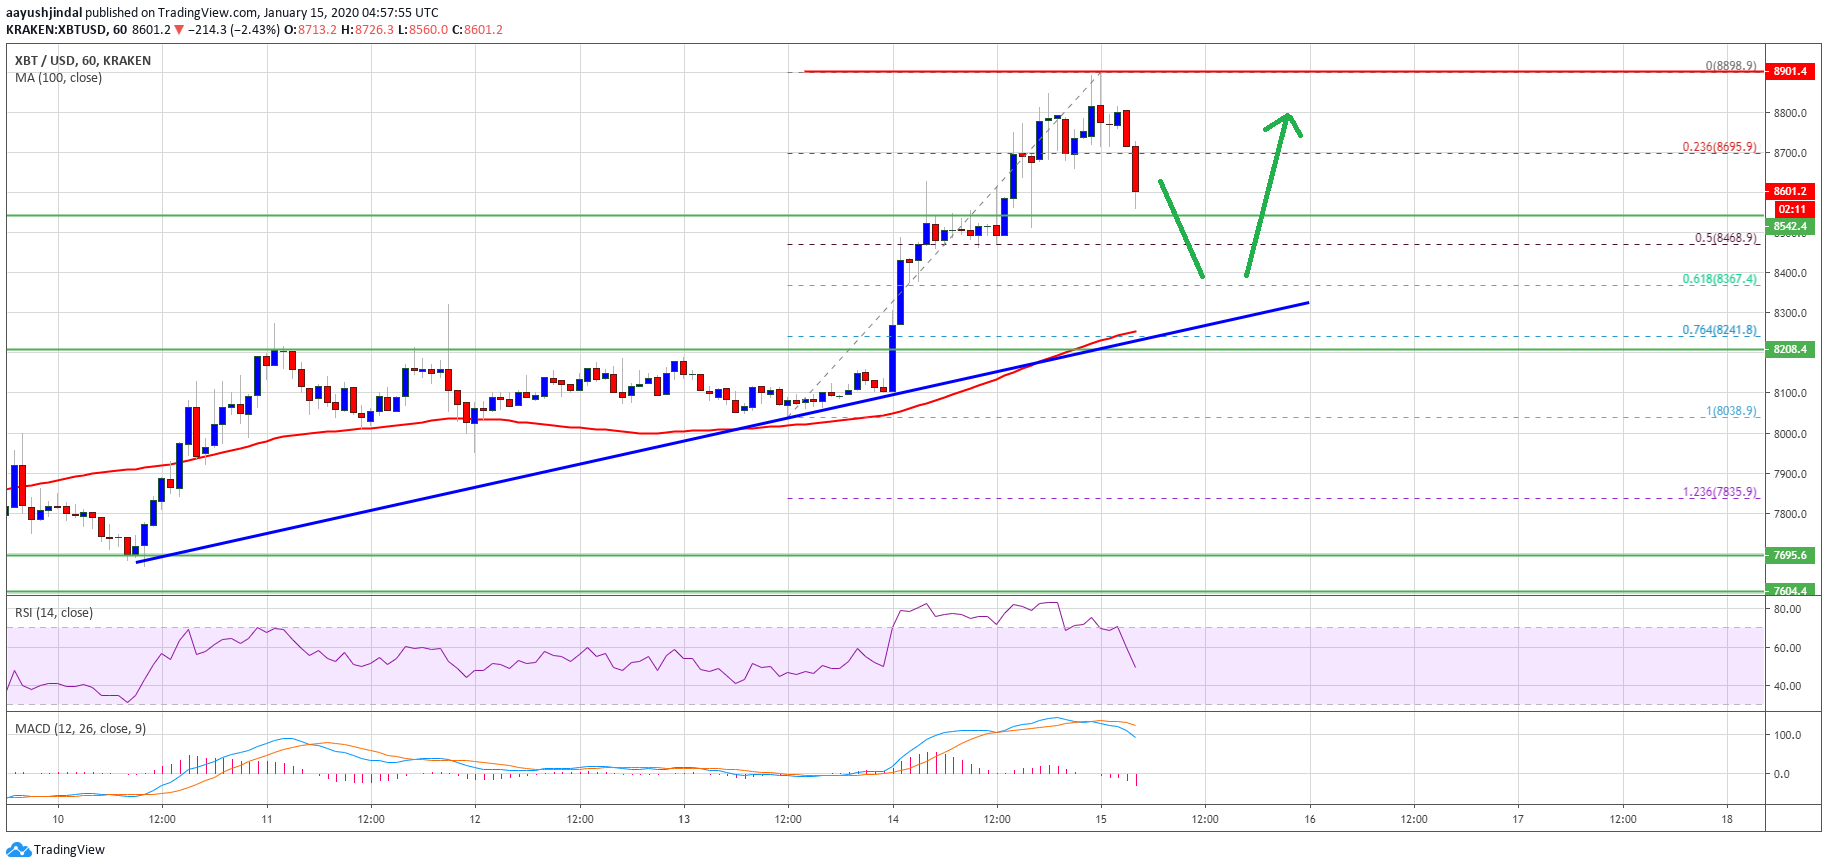
Additionally, there is a key bullish trend line forming with support near $8,300 on the hourly chart of the BTC/USD pair. Therefore, dips in bitcoin towards the $8,400 and $8,300 may perhaps find solid bids.
Can BTC Rise To $9,200?
The current trend is very positive and the recent break above $8,600 was convincing. In the short term, there might be a downside correction towards $8,400.
Once a correction phase is complete, BTC bulls are likely to make another attempt to clear the $8,800 and $9,000 resistance. The main hurdle for a larger move towards $10,000 is near the $9,200 level.
If bitcoin price fails to clear $9,000 and $9,200, it is likely to start a larger decline towards the $7,200 and $7,000 support levels in the coming days.
Technical indicators:
Hourly MACD – The MACD is now back in the bearish zone, with negative signs.
Hourly RSI (Relative Strength Index) – The RSI for BTC/USD is now below 60 and it is likely to extend its decline.
Major Support Levels – $8,460 followed by $8,300.
Major Resistance Levels – $8,700, $8,800 and $9,000.