Key Points
- Bitcoin cash price finally gained traction and moved above the $2700 level against the US Dollar.
- There was a break above two bearish trend lines with resistance at $2440 on the hourly chart of BCH/USD (data feed from Kraken).
- The pair is now placed nicely above the $2500 support and the 100 hourly simple moving average.
Bitcoin cash price is back in the bullish zone above $2500 against the US Dollar. BCH/USD made a nice upside move and is currently above the $2700 level.
Bitcoin Cash Price Trend
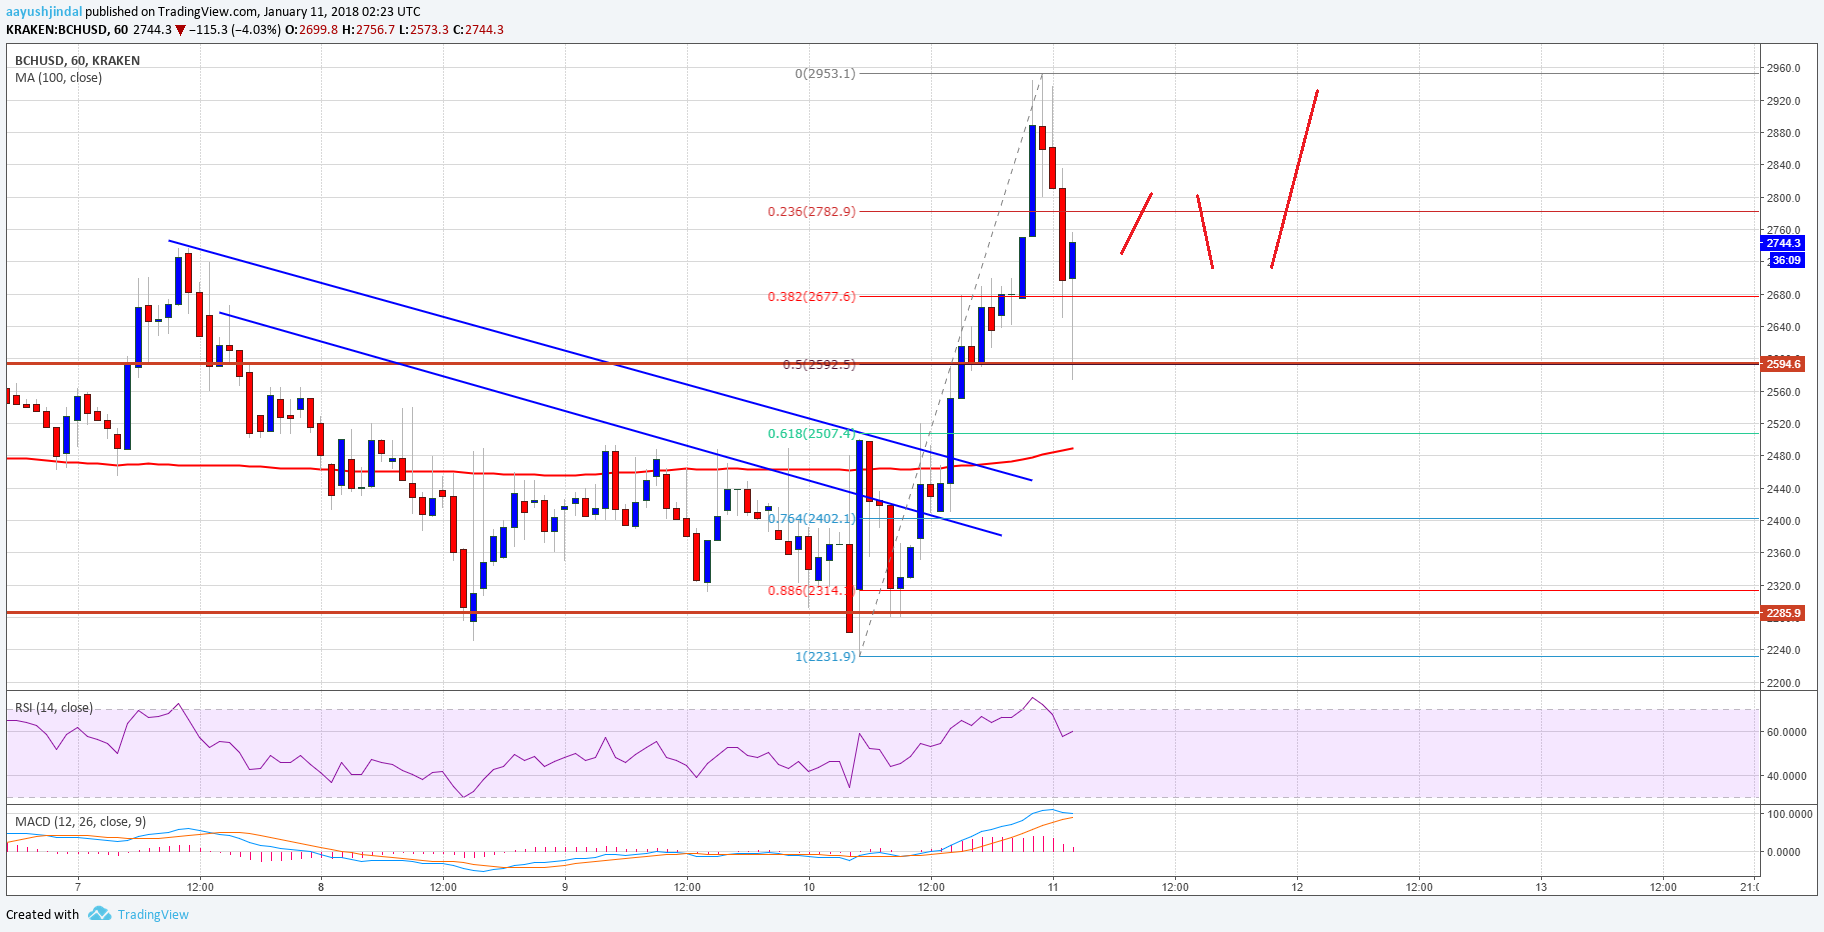
During the past three days, we saw a consolidation pattern in bitcoin cash price above $2280 area against the US Dollar. The price struggled to move above the $2450 and $2500 resistance levels. However, the past two sessions were positive, as the price moved above the $2450 resistance. It also succeeded in breaking the 76.4% Fib retracement level of the last decline from the $2750 high to $2250 low.
During the upside move, there was a break above two bearish trend lines with resistance at $2440 on the hourly chart of BCH/USD. It opened the doors for more gains and the pair moved above the $2700 level. The upside move was strong and a high was formed at $2953. At the moment, the price is correcting lower toward $2700. It has already breached the 23.6% Fib retracement level of the last wave from the $2231 low to $2953 high. However, the downside move was protected by the $2600 support area.

Moreover, the 50% Fib retracement level of the last wave from the $2231 low to $2953 high also acted as a support. The pair is now resuming its uptrend and it may soon break the $2800 level once again.
Looking at the technical indicators:
Hourly MACD – The MACD for BCH/USD has slightly reduced its bullish slope.
Hourly RSI (Relative Strength Index) – The RSI for BCH/USD is currently nicely placed above the 50 level.
Major Support Level – $2500
Major Resistance Level – $2800
Charts courtesy – Trading View, Kraken


