
Reason to trust
How Our News is Made
Strict editorial policy that focuses on accuracy, relevance, and impartiality
Ad discliamer
Morbi pretium leo et nisl aliquam mollis. Quisque arcu lorem, ultricies quis pellentesque nec, ullamcorper eu odio.
Bitcoin corrected lower sharply from the $10,500 resistance against the US Dollar. However, BTC is still above the key $9,800 support and it could soon rally again.
- After trading to a new 2020 high, bitcoin price corrected lower from $10,507 against the US Dollar.
- The price declined below the $10,200 and $10,000 support levels.
- There is a key bullish trend line forming with support near $9,800 on the 4-hours chart of the BTC/USD pair (data feed from Kraken).
- The pair is well supported above $9,800 and the 100 simple moving average (4-hours).
Bitcoin Could Rally Again
This past week, bitcoin maintained a bullish bias above the $10,300 area against the US Dollar. BTC price extended its rally towards the $10,500 level and settled above the 100 simple moving average (4-hours).
Finally, the price traded to a new 2020 high at $10,507 before starting a downside correction. It seems like the price made a couple of attempts to gain pace above $10,500, but the bulls failed.
As a result, there was a bearish reaction below the $10,400 and $10,300 levels. Besides, the price declined below the $10,200 support area. More importantly, there was a spike below the $10,000 support area.
However, bitcoin found a strong support near $9,800 (the last breakout zone) along with the 100 simple moving average (4-hours). A swing low is formed near $9,764 and the price is currently rising.
Additionally, there is a key bullish trend line forming with support near $9,800 on the 4-hours chart of the BTC/USD pair. It is now trading above the 23.6% Fib retracement level of the recent correction from the $10,507 high to $9,764 low.
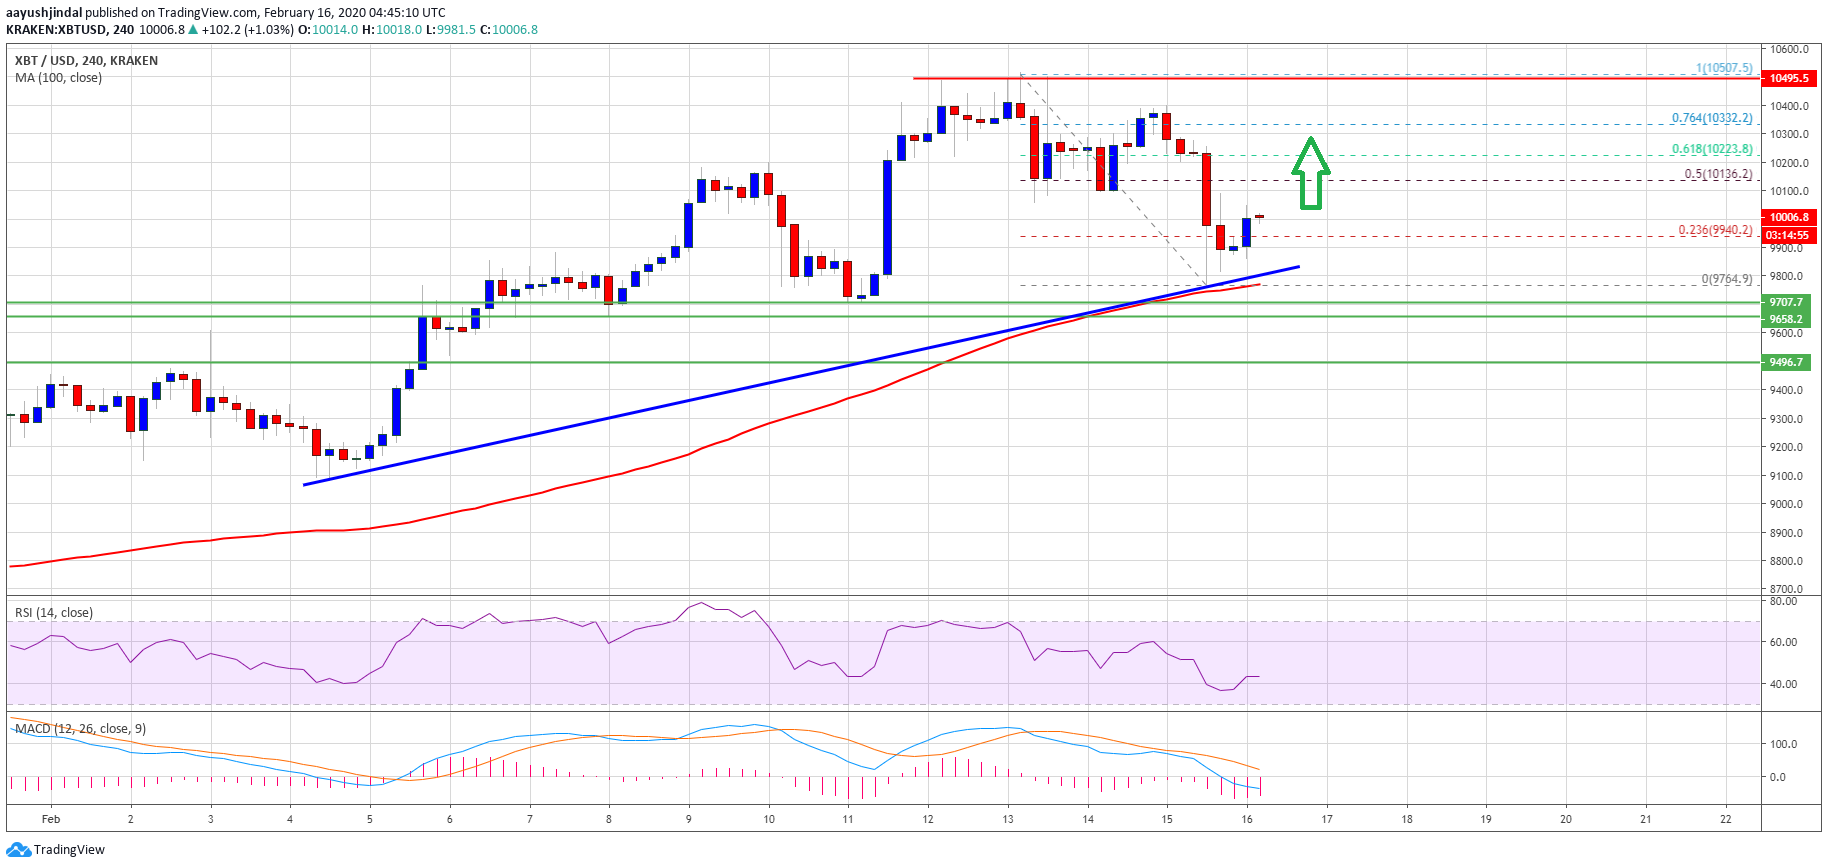
On the upside, an initial hurdle for the bulls is near the $10,140 level. It coincides with the 50% Fib retracement level of the recent correction from the $10,507 high to $9,764 low.
Therefore, a clear break above the $10,140 and $10,200 levels could open the doors for a larger upward move in the coming sessions. In the mentioned case, the bulls may perhaps eye a break above $10,500 and a test of the $11,000 area.
More Downsides?
On the downside, the $9,800 support and the 100 simple moving average (4-hours) hold the key. If there is a daily close below the $9,800 support, bitcoin price may even struggle to stay above the $9,500 support.
In the mentioned bearish case, the price is likely to extend its downside correction towards the $9,000 support area.
Technical indicators
4 hours MACD – The MACD for BTC/USD is losing pace in the bearish zone.
4 hours RSI (Relative Strength Index) – The RSI for BTC/USD is just above the 40 level.
Major Support Level – $9,800
Major Resistance Level – $10,200


