A little earlier on today, shortly before the opening of the European session, we published our latest bitcoin price technical analysis piece highlighting action overnight and suggesting the levels around which would watch price action in order to infer a bias throughout the day. Now price has matured, what has action told us about the likely future direction of the bitcoin price as we head into the US afternoon session, and what can we infer from action around particular levels? Take a quick look at the chart.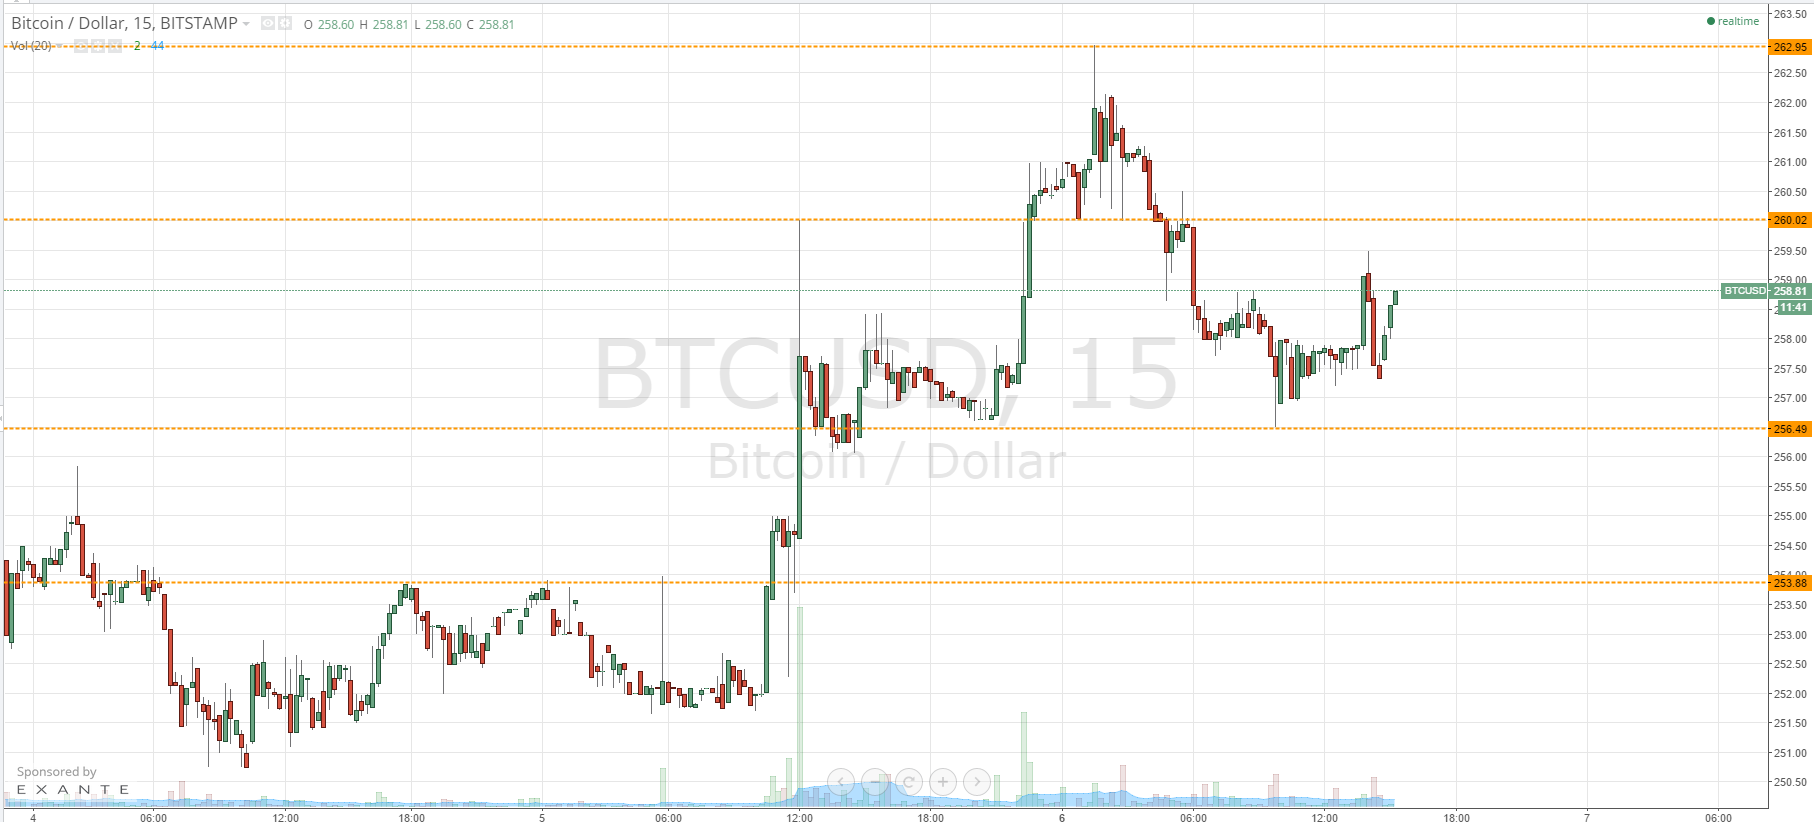
As you see, having reached highs of 216.95 earlier this morning, the bitcoin price declined into the European session to trade between what now serves as in term support at 256.49 and resistance at 260.02. These are the levels we will be watching. If today’s action has just been something of a correction from the aforementioned highs, we may see a quick return to the bullish momentum in the pair. We will look for a close above 260.02 to validate an initial upside target of aforementioned highs at 216.95 stop in such a scenario, a stop loss somewhere around 259.50 would keep risk tight and offer us a nice reward profile for a long trade.
Conversely, if we see a run back down towards 256.49 (in term support) we will look for a close below this level to validate 253.8 medium-term. Once again, a well-placed stop loss (somewhere around the 257 Mark in this scenario) would ensure we are taken out of the trade for just a small loss in the event of a bias reversal.
Charts courtesy of Trading View