

Throughout all of 2019, Bitcoin price has been on a steady ascent. For the greater portion of the year, Bitcoin appeared to be unstoppable and broke through resistance after resistance, even as the altcoin market bled out.
But last Sunday, Bitcoin price closed two consecutive weekly red candles for the first time since the bull rally began, and if tomorrow night’s daily closes below $10,100, it’ll also be the first time that Bitcoin closed two consecutive monthly candles in all of 2019. But what does that mean for the first-ever crypto asset and its current bull trend?
Bitcoin Price Could Close Second Monthly Red Candle in a Row
During times of such critical price action, daily closes on Bitcoin price charts become extremely significant, as higher time frames often dictate trend changes and help analysts predict future price movements.
Related Reading | Altcoins Still In a Bear Market, But What About BTC?
The higher the timeframe gets, the more significant. Last Sunday night, Bitcoin price closed its second consecutive weekly red candle, marking the first time it has done so since Bitcoin first began to climb in February 2019 after bouncing off the 200-week moving average – an important long-term trend indicator.
Now, tomorrow night is the monthly close and at current prices, Bitcoin is at risk of closing its second monthly red candle in a row. If it does so, it’s the first time this has happened in all of 2019. however, it’s not yet clear what this means for Bitcoin price and its short term trend.

In Case of Trend Change: Bullish and Bearish Scenarios
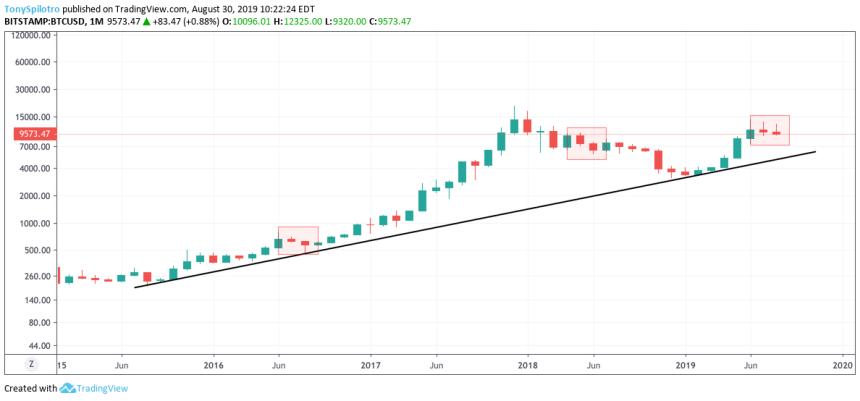
Two monthly candle closes in a row could be significant. In 2018, two consecutive red monthly in a row is what really kicked the bear market up a notch. Following two months of red, Bitcoin price closed the next month green, followed by an unprecedented six monthly candle closes in a row, taking the crypto asset down to its eventual bottom in December 2018.
If the current two red closes indicate a reversal back into the bear market, a November 2018 style drop may actually become a reality.
However, there’s hope for bulls yet. During the last bull run, the only time Bitcoin price closed two monthly red candles in a row, was in July and August of 2016. After BTC bounced from there, it went on to never again close two monthly red again, until the aforementioned 2018 bear market starting point.
Related Reading: Crypto Analyst: BTC/USD Indicator Resembles Mid-2016 Bullish Beginnings
The next few months should determine if Bitcoin price is still locked in a bear market, or if this was that reaccumulation phase before the bull run really begins, and Bitcoin reaches and sets a new all-time high.