

Late yesterday evening shortly before markets closed in Europe, we published our twice-daily bitcoin price watch piece. We noted that – among all the volatility – a pattern had formed the previous evening and that this pattern had likely initiated some downside momentum in the bitcoin price during yesterday’s session. Now, as action has matured over the Asian session, the levels that we were watching yesterday still the same, or have we broken out of our slated range to carve out some fresh key parameters today? Take a quick look at the chart below.
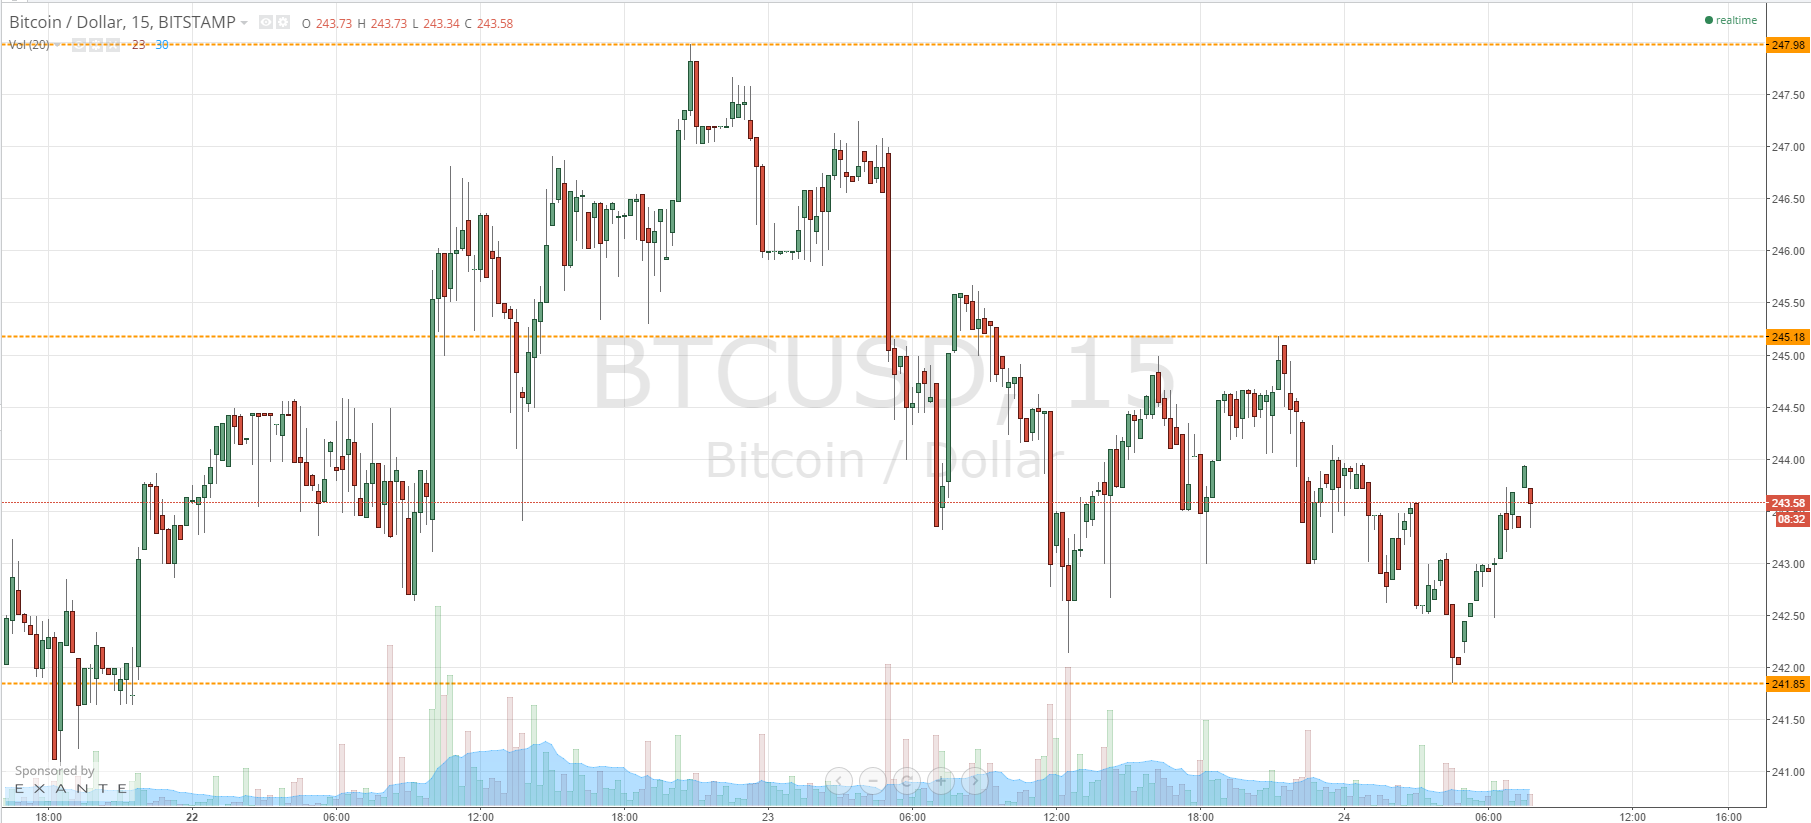
As chart shows, having traded up towards just below what we had slated as in term resistance yesterday, we hit highs shortly before midnight last night of 245.18. This is the level that now serves as in term resistance as we head into today’s session. From this level corrective bounce down to below yesterday’s lows of 242.2, to reach 241.85 – today’s lows and the level that serves as in term support to complete the day’s range.
We are currently trading mid-range, so we will look for anything bullish to break above 245.18 and present us with an initial upside bias. On such a bias, a primary target would be 247.98 to the upside – a level that represents weekly highs and gives us plenty of room to draw profit from the market whilst maintaining a realistic stop loss around 244 flat.
Looking the other way, if the bearish momentum we saw overnight continues today, and we get a break below 241.85 to the downside, it will put us short towards an initial target of 238 flat. With about four dollars worth of reward in this trade, a stop loss somewhere around 243 will maintain a positive risk reward profile while leaving enough room for us to chopping and out of the range in the event of a retest?
Charts courtesy of Trading View